
SheetTimeline User Guide — view your Excel project plan as a timeline
Version 1.5.0 · Last updated 2026-09-10
SheetTimeline — User Guide
Version: 1.5.0 · Last updated: 2026-09-10
A plain-language guide to using SheetTimeline: how to load your Excel plan, read the screens, make light edits, and export your updated plan. Written for project people, not developers.
© 2026 K. Qadir. All content, screenshots, and documentation are the property of K. Qadir and may not be copied, redistributed, or reused without written permission.
1. What is SheetTimeline?
SheetTimeline turns your Excel project plan into a clear, day-by-day timeline you can actually work
from. You upload your plan .xlsx once, and the app shows it as:
- a weekly board (what's happening each day this week),
- a day list (everything on a single day),
- a timeline (project-wide, grouped by stage),
- a network view of task dependencies and the critical path, and
- a My tasks view for any owner or combination of owners.
You can tick tasks off, adjust dates, add notes, mark milestones, capture a schedule baseline, and add entirely new tasks — then export a new copy of your Excel file with your edits written back in. The rest of your spreadsheet (formulas, formatting, other sheets, other columns) is left exactly as it was.
Your file never leaves your computer. There is no login and no upload to a server. Everything runs in your browser.
2. Getting started
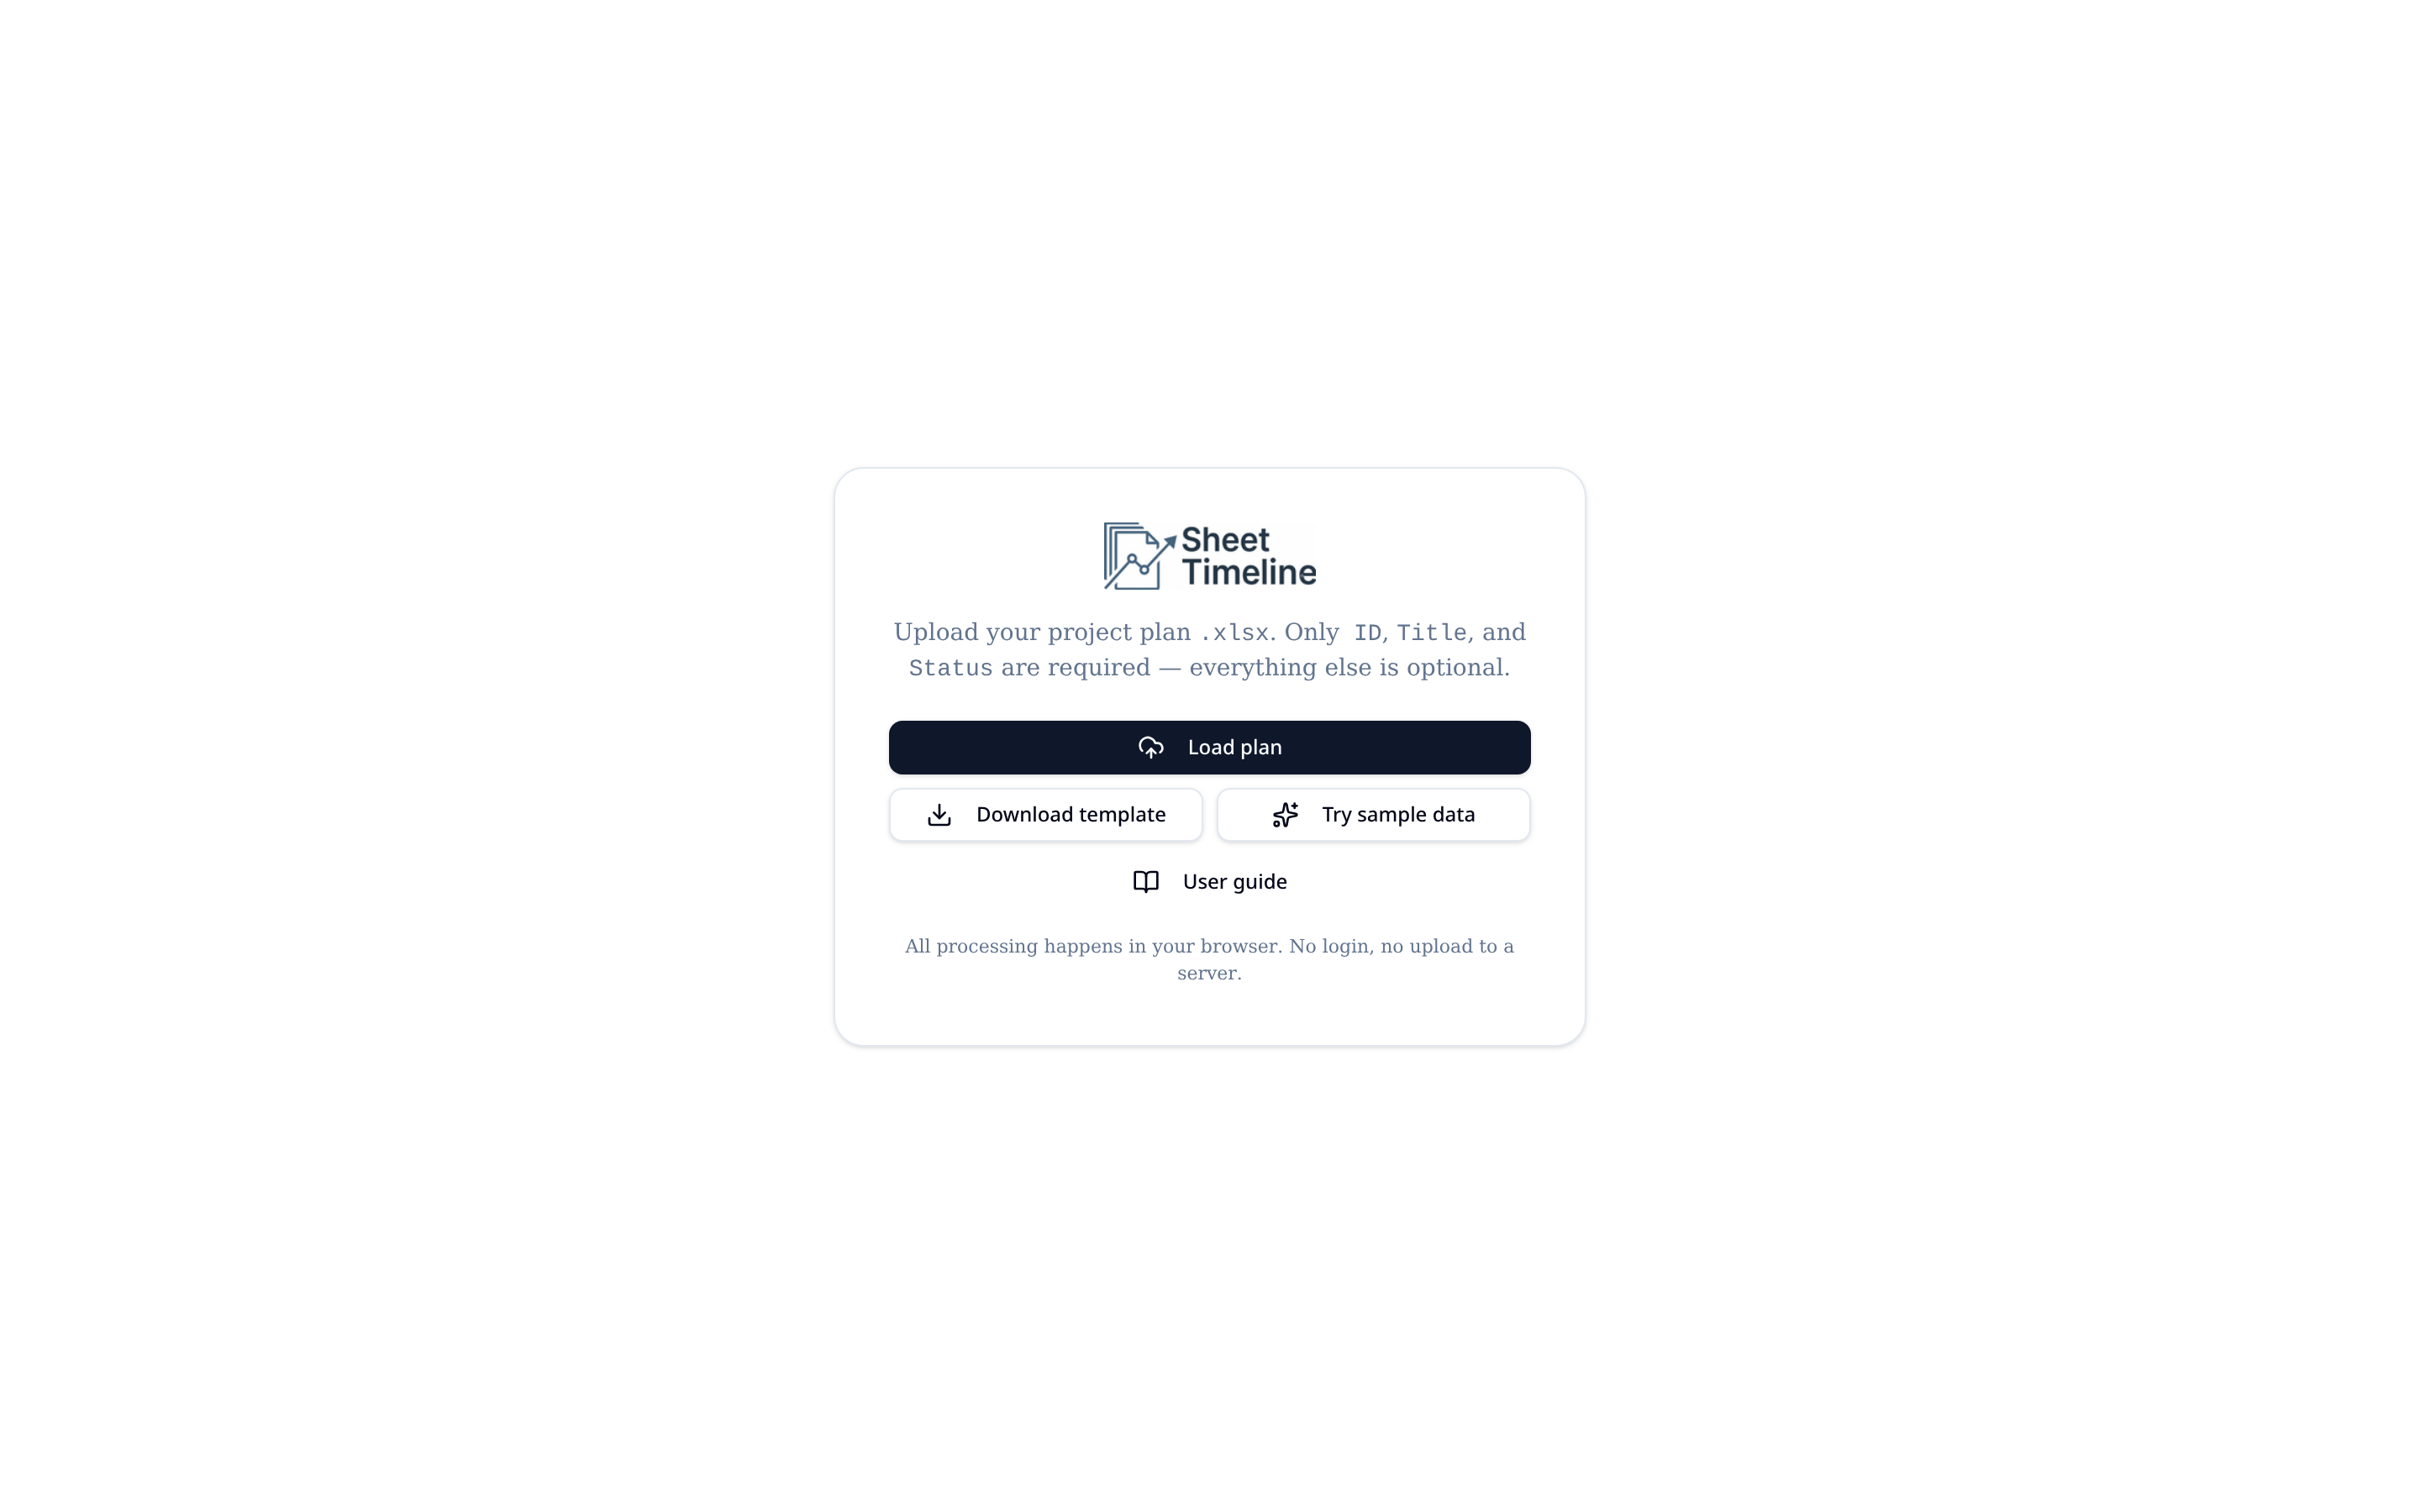
When you open SheetTimeline for the first time you'll see the home screen with three ways to begin.
2.1 Try sample data (fastest)
Click Try sample data to load a realistic demo plan (about 39 tasks across nine owners). It is built to show every feature at once: long dependency chains with fan-in/fan-out so the Network view has a real critical path, overlapping assignments so the Owner workload heatmap shows hot weeks, milestones spread across stages for the Stage and Milestones strips, and a mix of overdue, blocked, deferred, and undated tasks so each grouping in My tasks has content.
Nothing is downloaded and nothing touches your real files — this is a safe way to click around and see how everything works. You can leave this session at any time by pressing End session in the top-right, which returns you to the home screen.
2.2 Download template
Click Download template to save a ready-made Excel file (task-viewer-template.xlsx) to your
computer. Open it in Excel or Google Sheets and fill in your own plan. The file has two sheets:
Tasks — one row per task. Only three columns are required:
- ID — a unique code for each task (e.g.
T-001). - Title — a short name.
- Status — one of five values:
NOT_STARTED,IN_PROGRESS,BLOCKED,DONE,DEFERRED.
Every other column (Stage, Workstream, Description, Owner, Depends_on, Critical_Path, Milestone, Notes, Epic, Start, End) is optional. If you leave a column out, the app quietly hides the parts of the screen that would have used it.
- ID — a unique code for each task (e.g.
How to use — a plain-English reference sheet inside the template that repeats the column rules so whoever fills the plan in has it at hand.
Save your file, come back to SheetTimeline, and click Load plan.
2.3 Load plan
Click Load plan and pick your .xlsx from your computer. SheetTimeline reads it in your browser
and drops you straight into the weekly board.
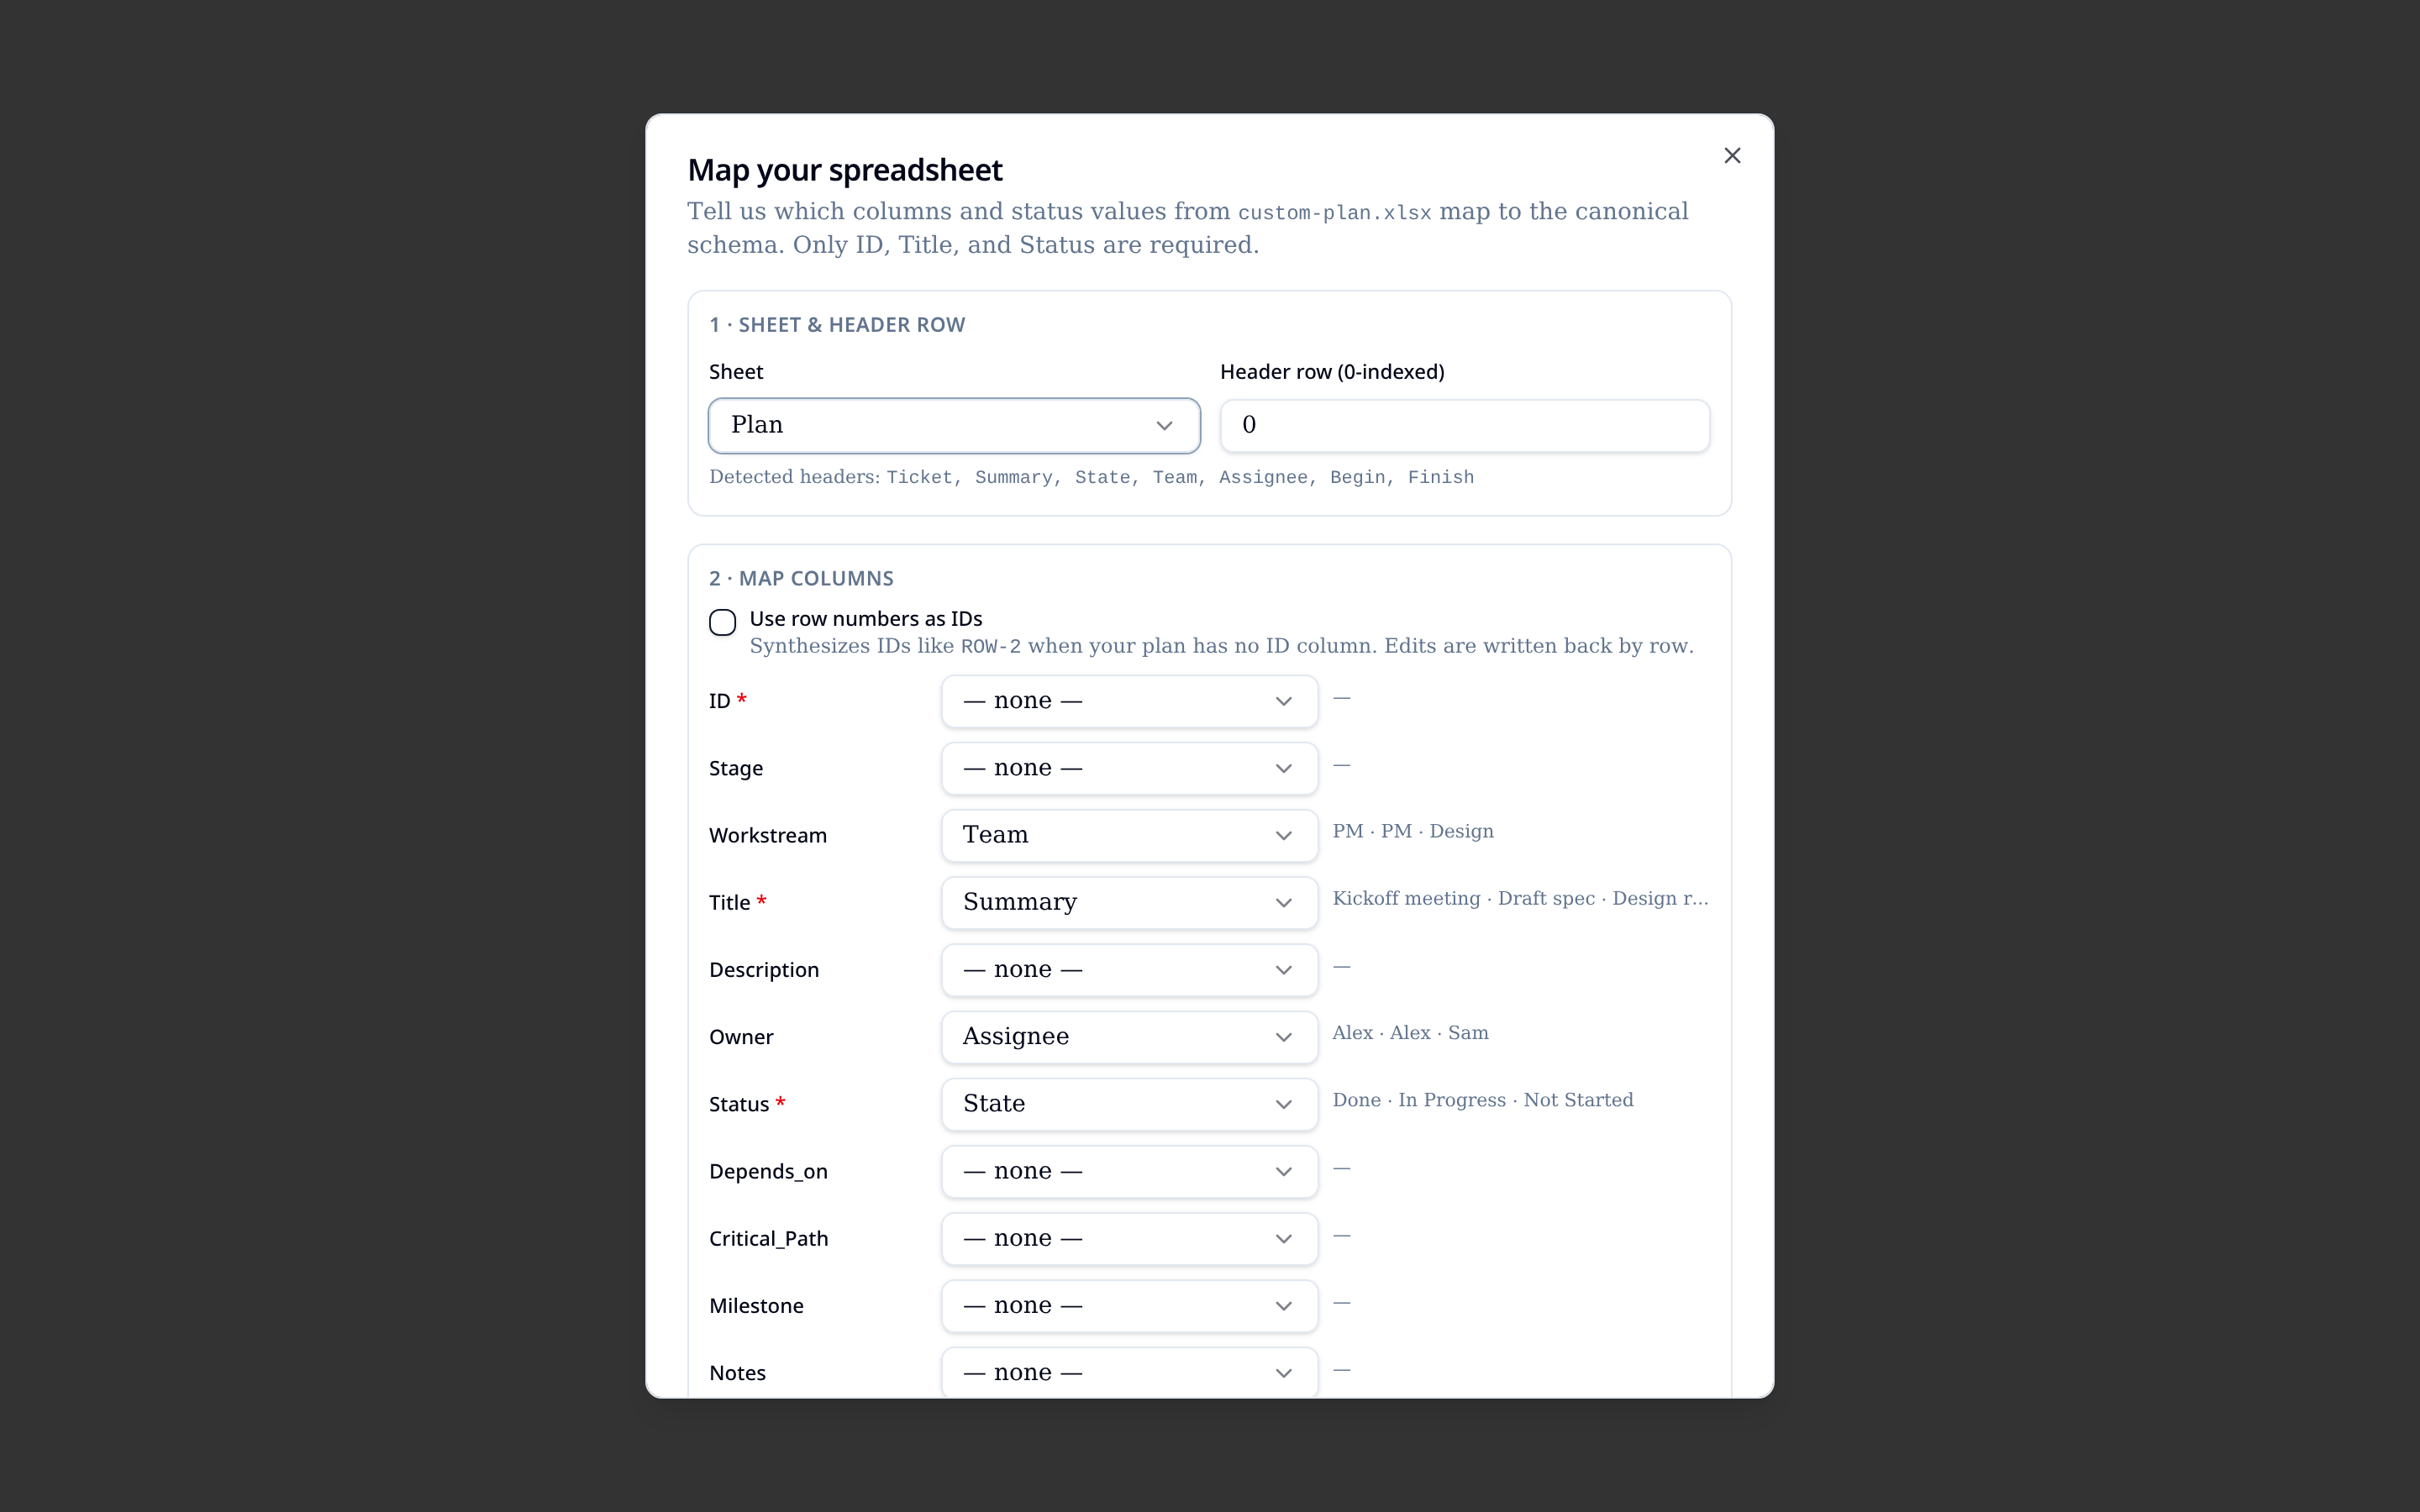
If your file doesn't match the template exactly (different column names, different sheet name, different status labels), the Mapping wizard opens automatically so you can point out which of your columns is the ID, which is the Title, and so on. Section 8 walks through the wizard in detail.
2.4 User guide
Click User guide at any time (from the home screen, or from Settings → User guide once a plan is loaded) to download a copy of this document as a self-contained HTML file you can read offline.
3. Reading the screen
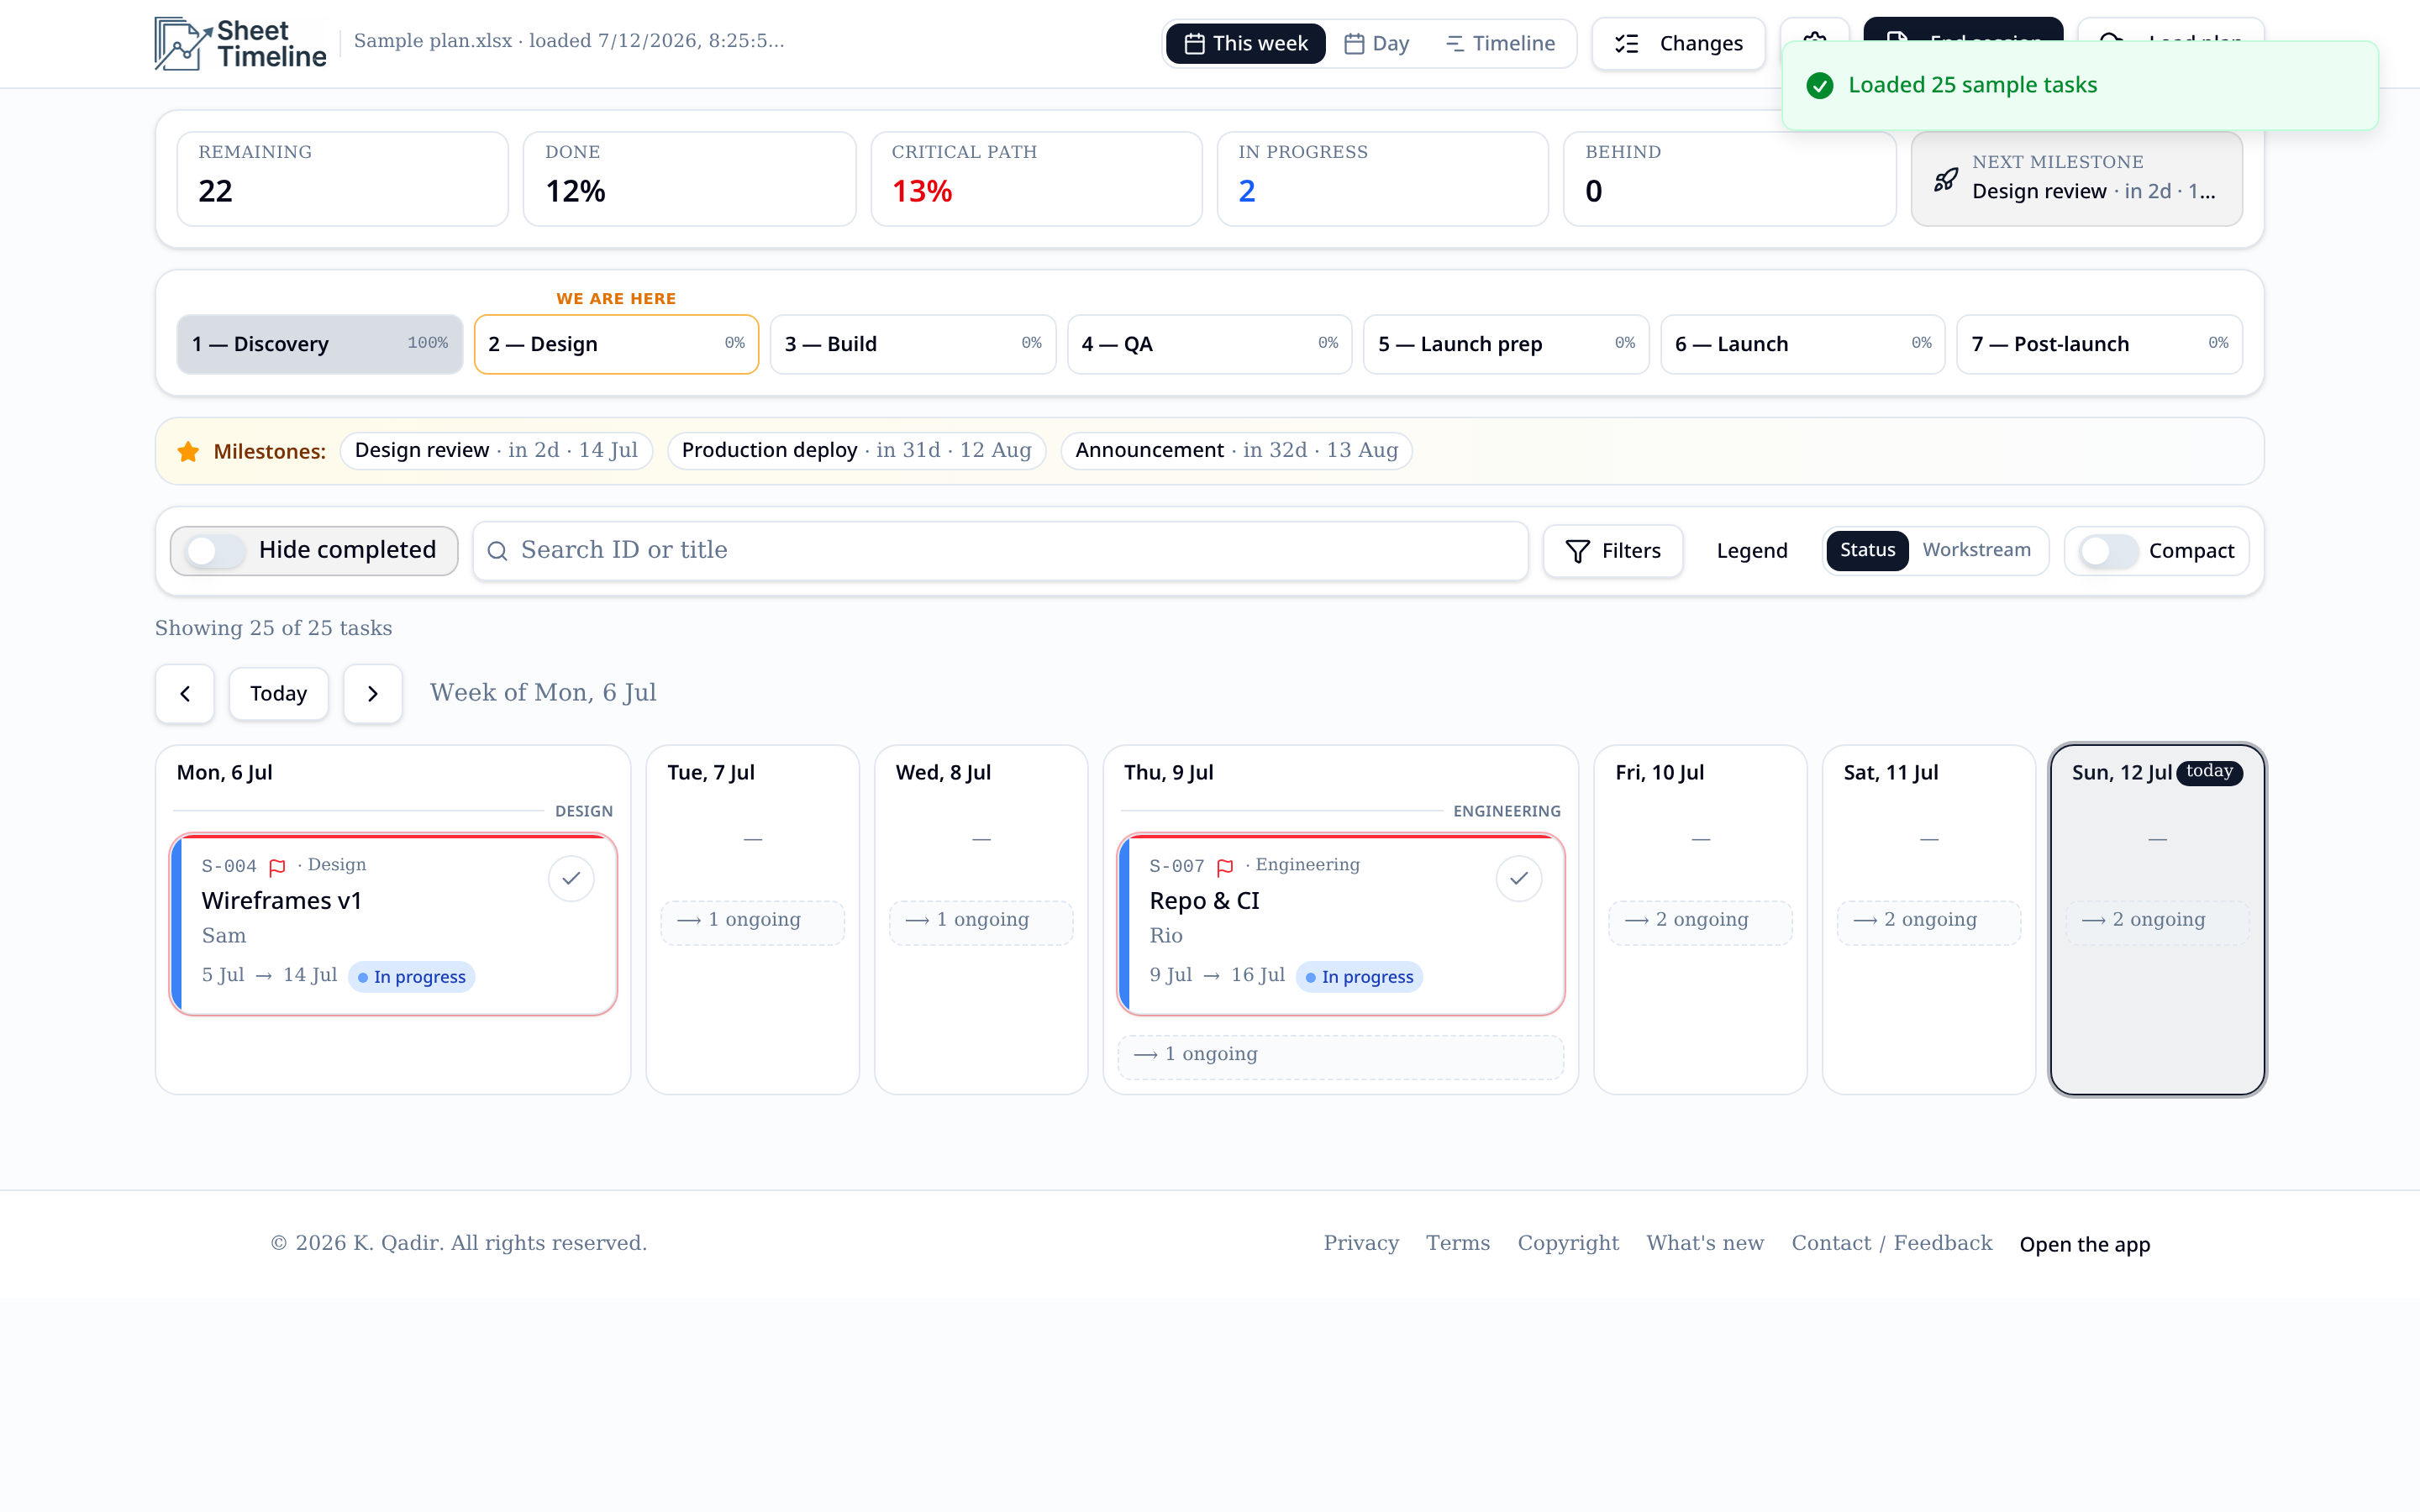
Once a plan is loaded, the screen is divided into clear working areas: Views, Plan actions, Project overview, Task filters, and the active schedule.
3.1 Views and plan actions
The Views row changes how you inspect the same plan: This week, Day, Timeline, Network, and My tasks appear here when the matching spreadsheet columns are available. New task stays at the top as the primary action. Bulk edit, Share, Changes, Settings, End session/export, and Load plan are grouped separately under Plan actions because they change, export, or replace the plan.
3.2 Project overview
The compact overview keeps overall completion, tasks behind schedule, and the next milestone visible. Choose Details to reveal the full KPI cards, Stage progress, and Milestones list. This keeps the schedule prominent while preserving the deeper project controls when you need them.
3.3 The KPI cards
Six small tiles across the top summarise the whole plan:
- Remaining — how many tasks aren't done yet.
- Done % — share of tasks marked
DONE. - Critical path % — of tasks flagged as on the critical path, how many are done. (Only shown if your plan has a Critical_Path column.)
- In progress — how many tasks are currently
IN_PROGRESS. Click this tile to filter the list to just those tasks. Click again to clear. - Behind — how many dated tasks are overdue or have a late start. Click this tile to filter to just the behind tasks. Click again to clear.
- Next milestone — the next upcoming milestone task and how many days away it is. Click it to open that task. (Only shown if your plan has a Milestone column.)
3.4 The Stage strip
Under the KPI cards. Shows one chip per Stage in your plan (e.g. 1 — Discovery, 2 — Design).
On top of each chip you'll see the stage's completion percentage. A dash — means that stage has
no active work with dates yet.
The chip covering the current date has a small "WE ARE HERE" label above it, so you always know which stage the project is in.
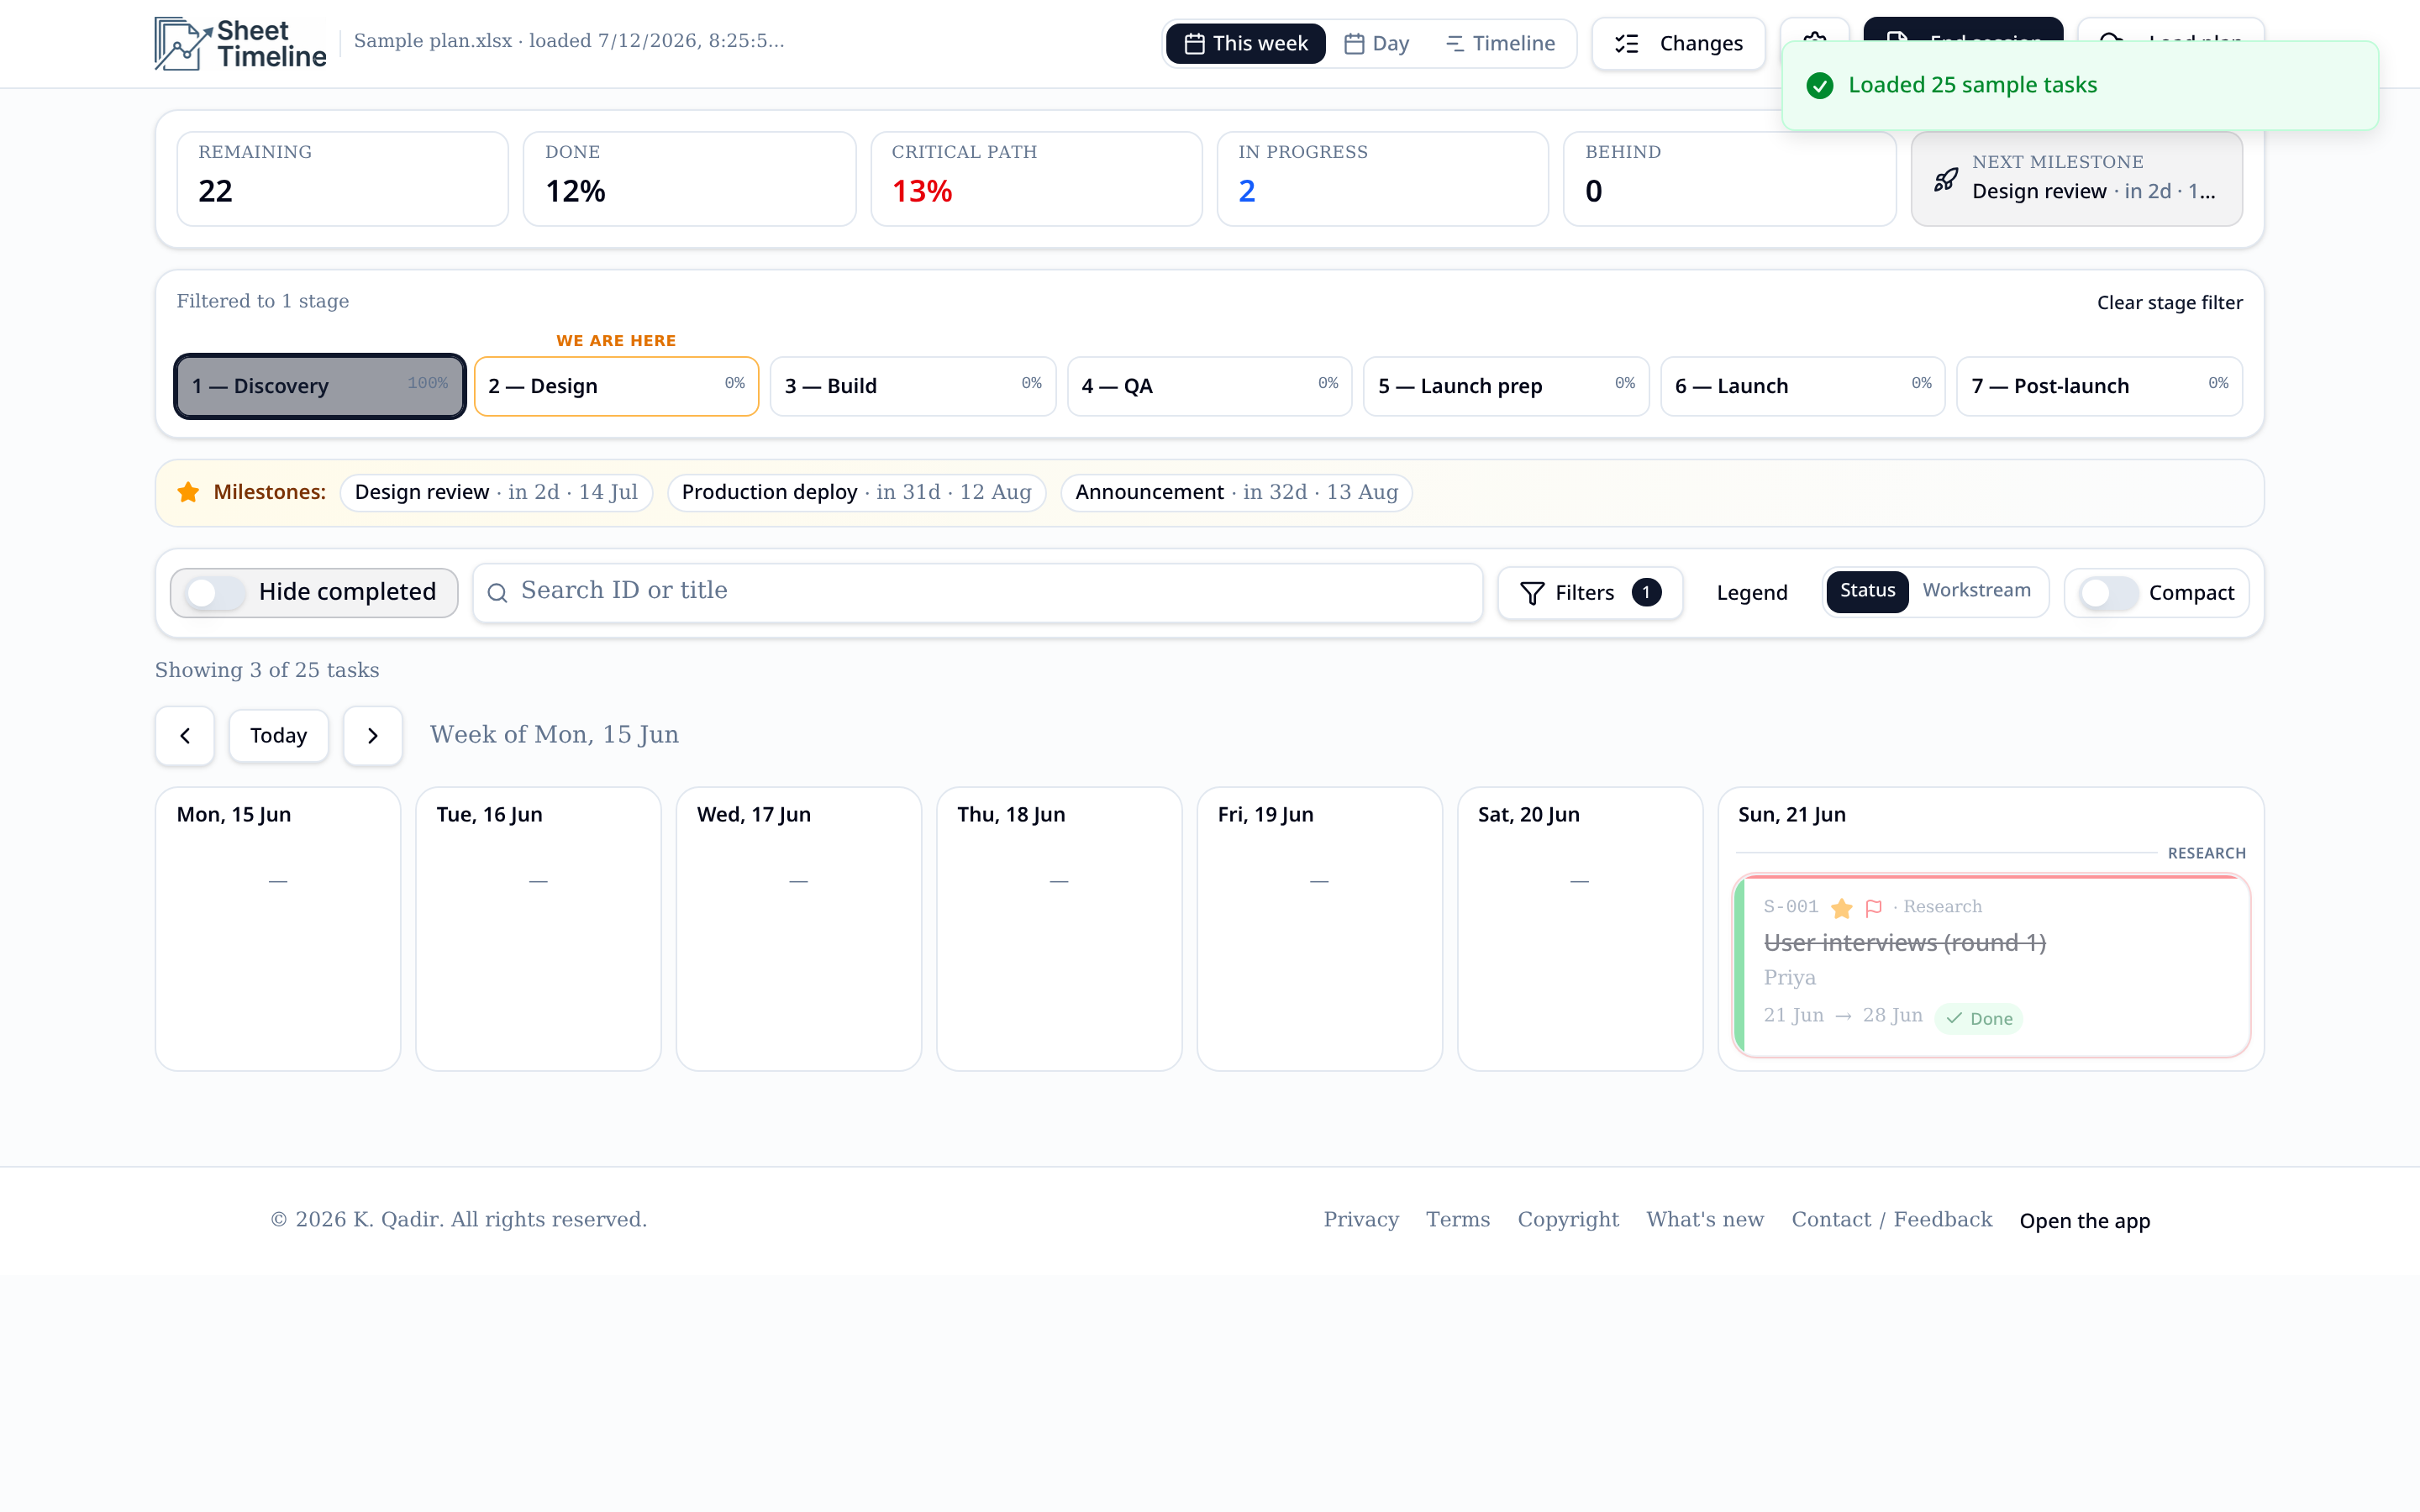
Click any stage chip to focus the schedule on that stage: the list filters to just those tasks and the calendar/timeline jumps to the earliest dated task in that stage. Click Clear (or click the same chip again) to remove the focus.
3.3 The Milestones strip
Under the Stage strip (only shown if your plan has a Milestone column). Shows every milestone task as a coloured pill with the milestone's date. Overdue milestones come first and are shown in red. Click any milestone to open its task panel.
3.4 Filters and the view switcher
Below the strips is the search + filter bar (covered in section 5) and, in the top-right of the header, the view switcher: This week, Day, Timeline, plus Network and My tasks when your plan has the right columns.
4. The five views
Use the buttons in the top-right of the header to switch between them. Your filters, search, and selections carry over.
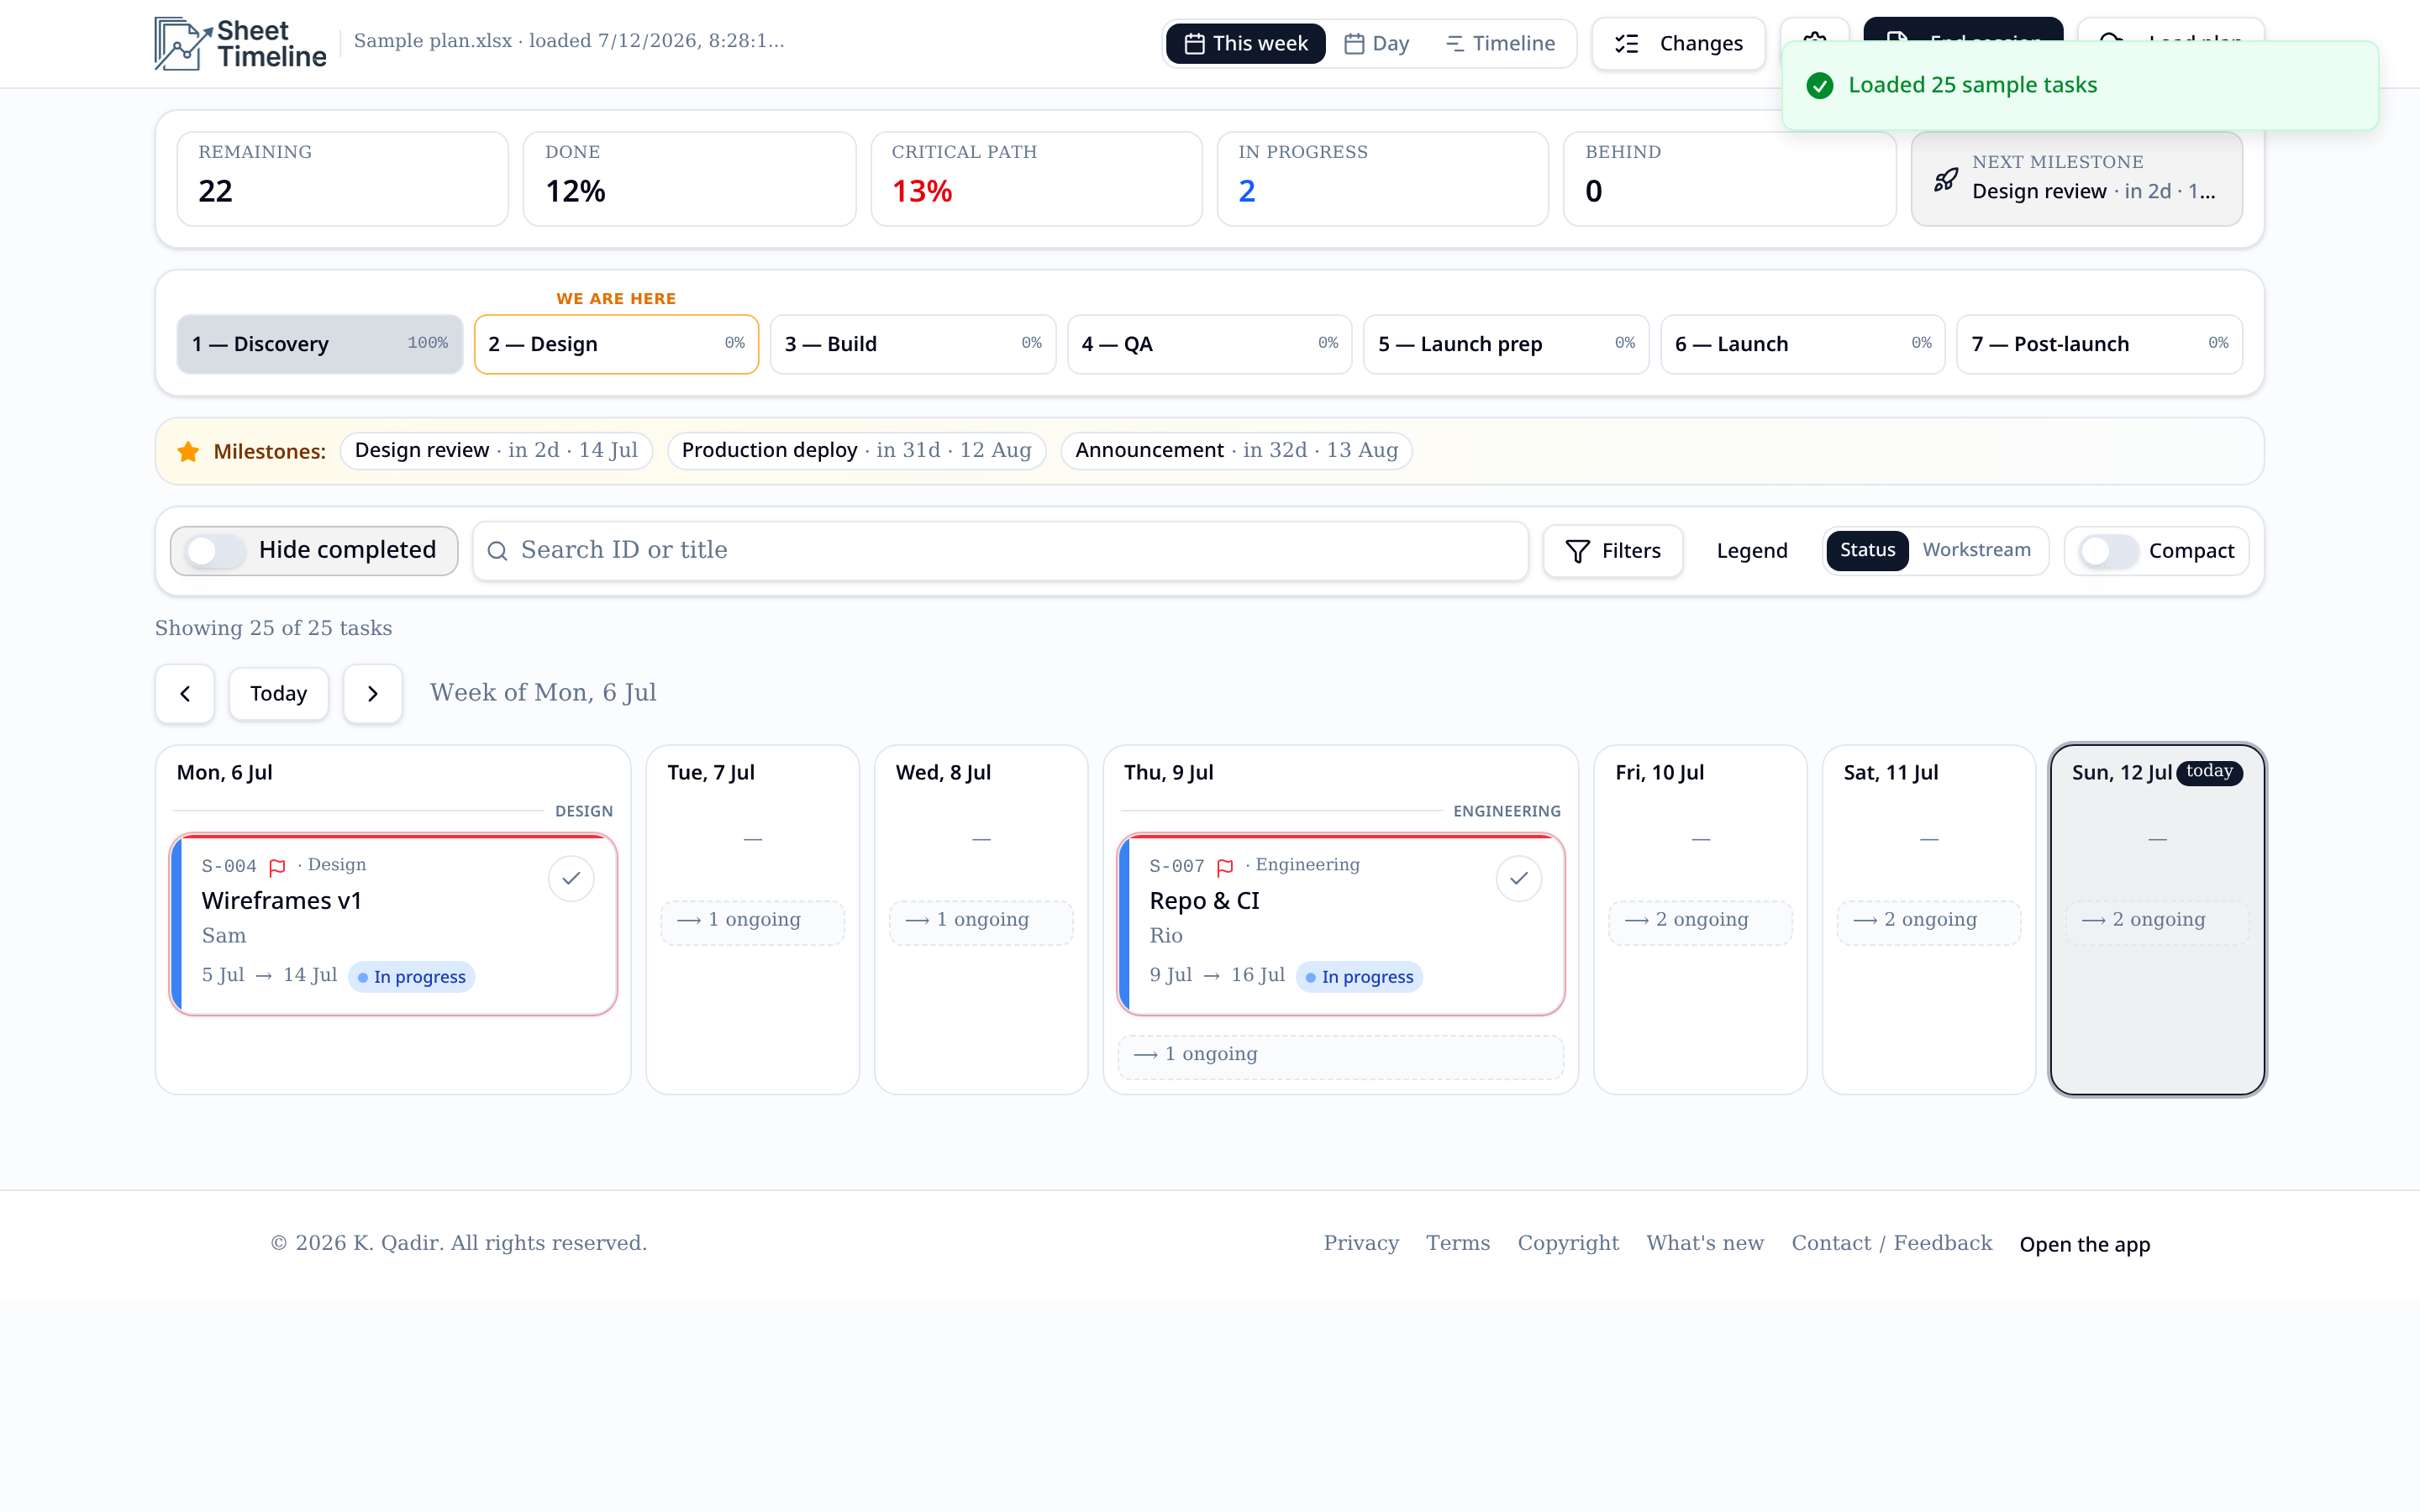
4.1 This week
The default view. Seven columns, one per day. Each task appears as a card on every day it covers. If a task spans past this week, its final visible card shows "⟶ N ongoing" so you know it continues. Click a card to open the task; click the small ✓ on a card to mark it done.
Click a day header to jump to the Day view for that specific day.
4.2 Day
A single day, top-to-bottom, with all its tasks. Use the arrows or the date picker at the top to step through days. Back returns you to This week.
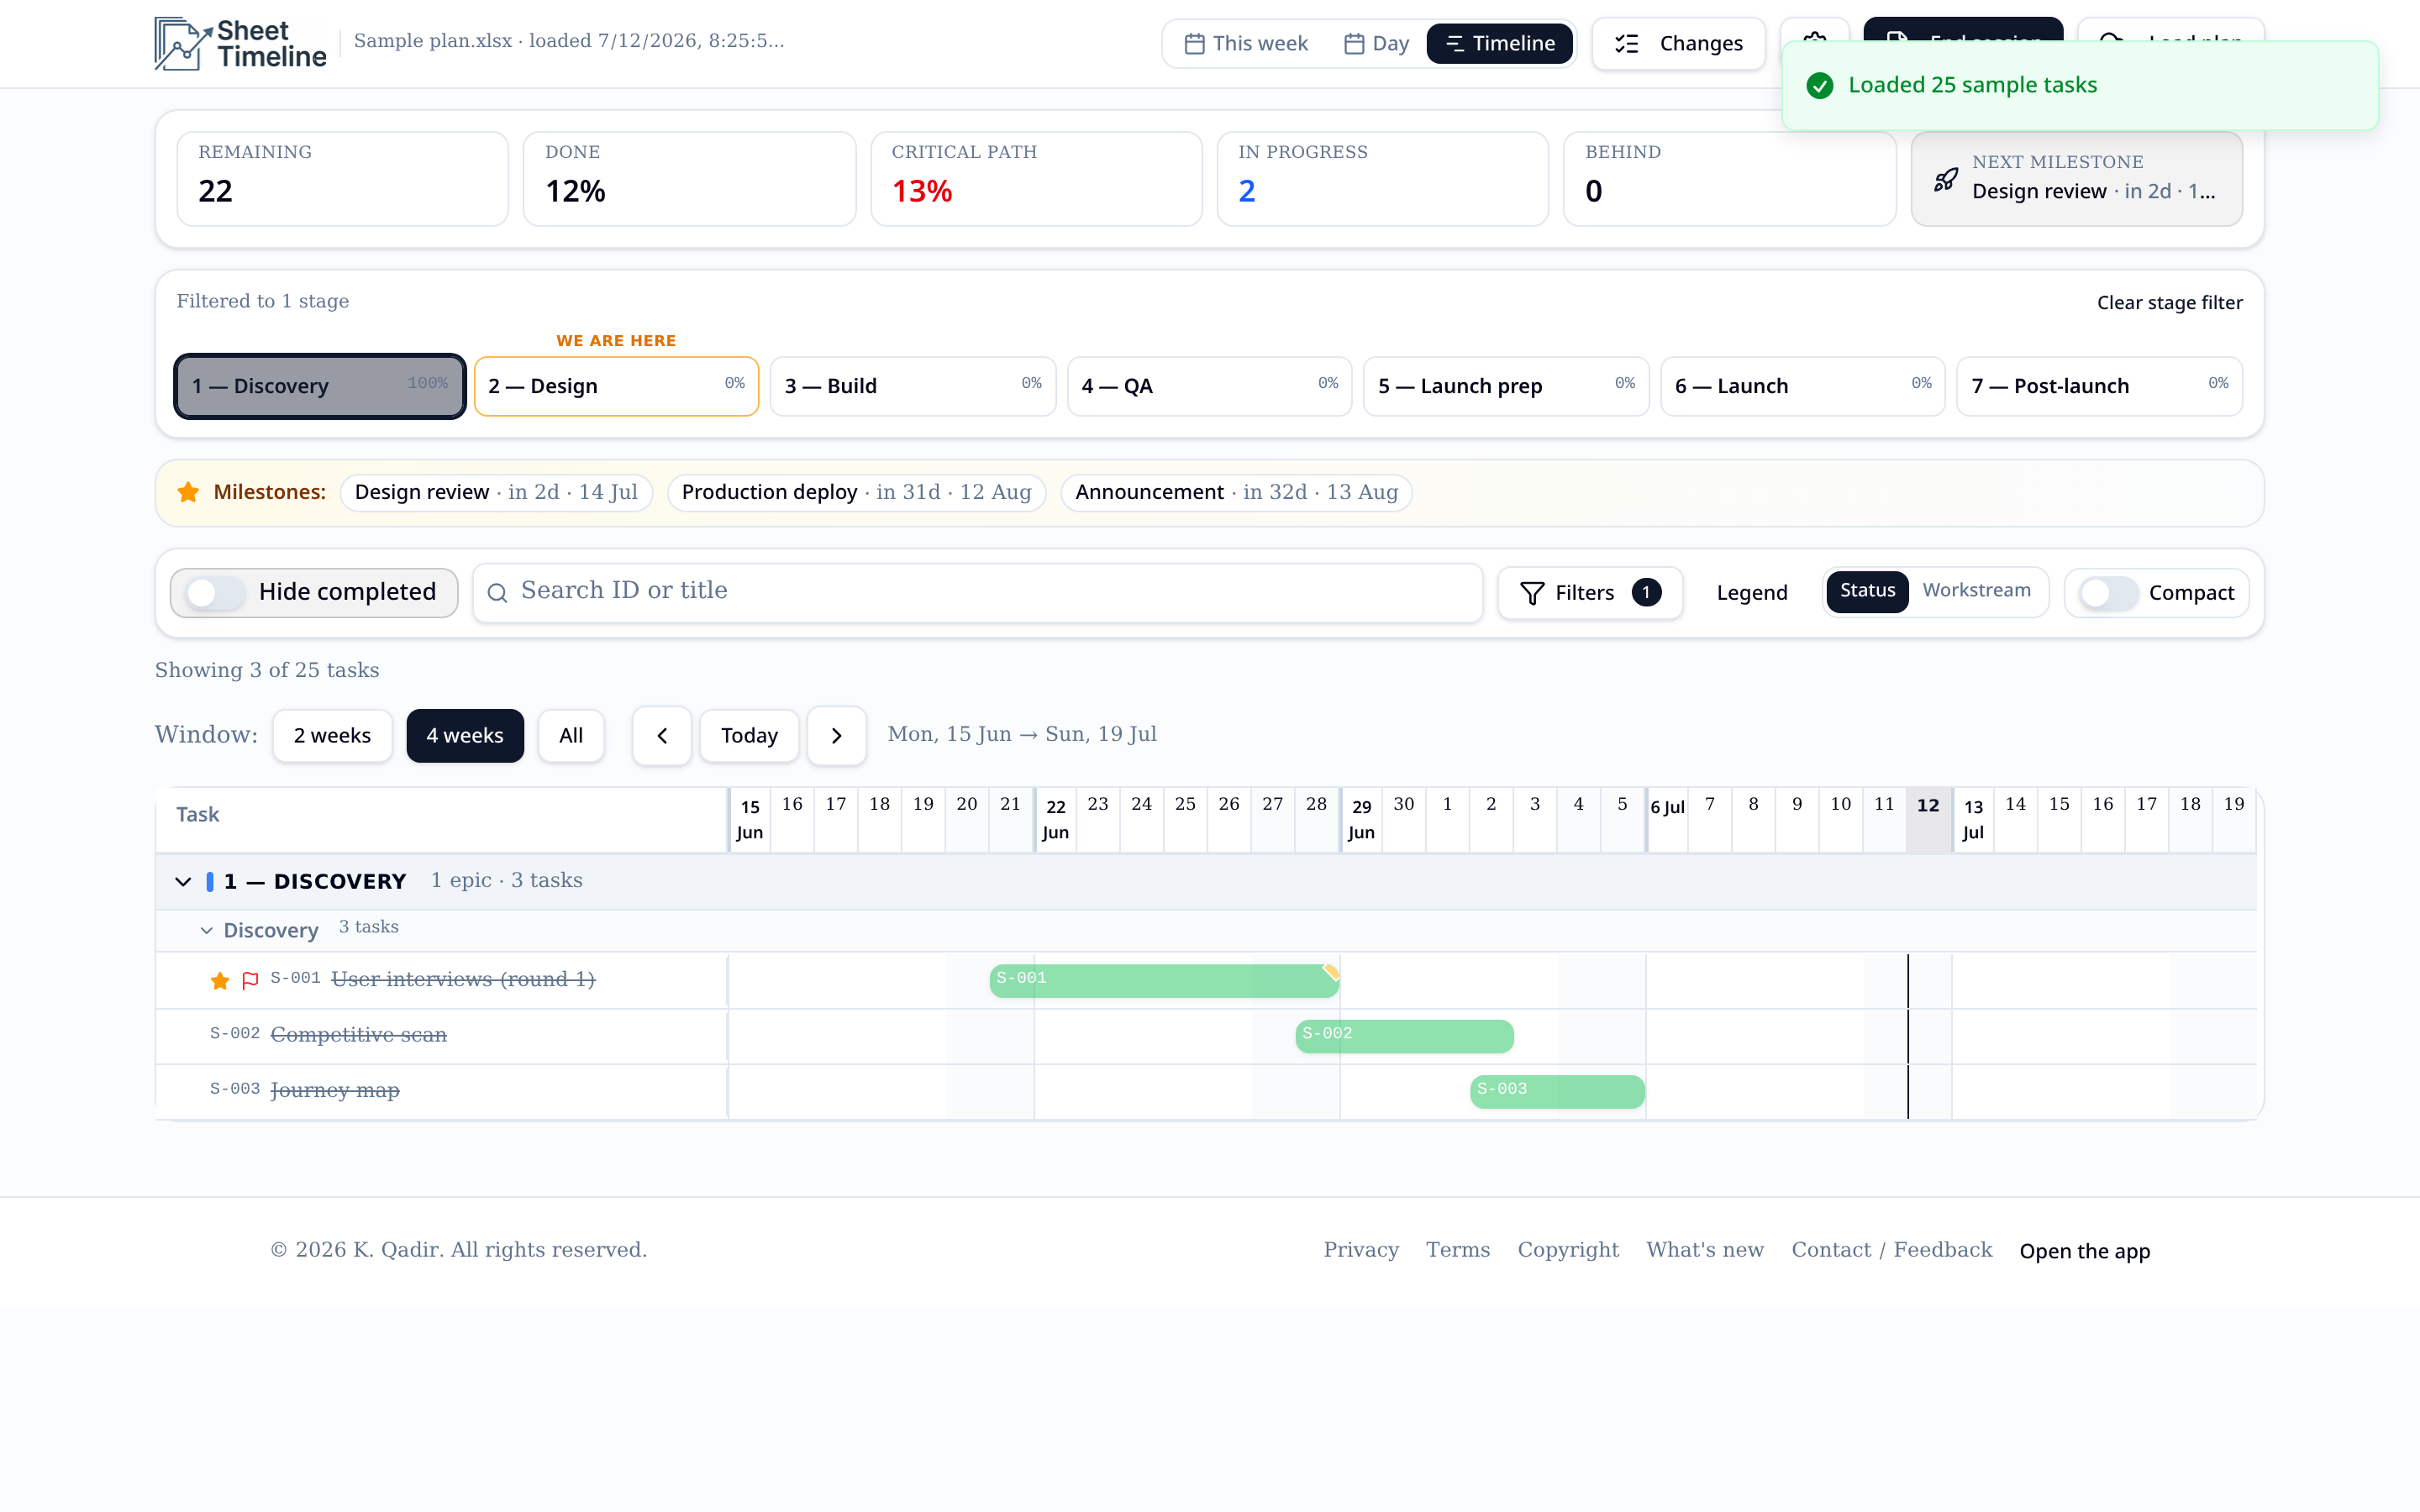
4.3 Timeline
A project-wide horizontal timeline, grouped by Stage (and by Epic inside a stage, if your plan has an Epic column). Each task is a bar from its Start to its End. A star marks a milestone; a flag marks a critical-path task. A vertical today line shows where "now" is.
Scroll left/right to move through time. Click a bar to open its task.
If your plan has no dates at all, the timeline is replaced by a friendly "This plan has no dates" message — the other views still work.
4.4 Network
Only shown if your plan has a Depends_on column.
A zoomable diagram of every task dependency. Tasks are boxes; arrows show what depends on what. The critical path is highlighted with a thicker line, and any circular dependency is ringed in red with a warning. Click any task box to open its task panel.
4.5 My tasks
Only shown if your plan has an Owner column.
A focused list for one or more owners. Pick any combination of owners from the dropdown at the top (the type-ahead field filters the list as you type), then choose a horizon of 2 weeks, 4 weeks, or All. Tasks are grouped as Overdue, This week, Later, or Undated.
Click the Workload tab to see a heatmap of how many tasks each owner has per week — darker cells mean more load. Click a cell to jump to that week in the Timeline view.
Click the small ✓ on a task card to mark it done, or click the task card to open the full panel. The Open in Timeline button jumps to the task's start week in the Timeline view.
5. Finding things
The filter bar sits between the strips and the current view.
- Search — matches by task ID or title.
- Filters — narrow by Workstream, Owner, Stage, Status; toggle Critical only and Behind only (dated tasks that are overdue or have a late start).
- Hide completed — hides
DONEandDEFERREDtasks. On by default. - Colour by — toggle between Status colours (default) and Workstream colours so cards and bars recolour to match how you're thinking today.
- Compact — a denser card layout when you have a lot on screen.
- Legend — a small key so you can see what each colour means at a glance.
Under the filter bar the counter reads "Showing N of M tasks" so you always know when a filter is in play.
6. Working with a task
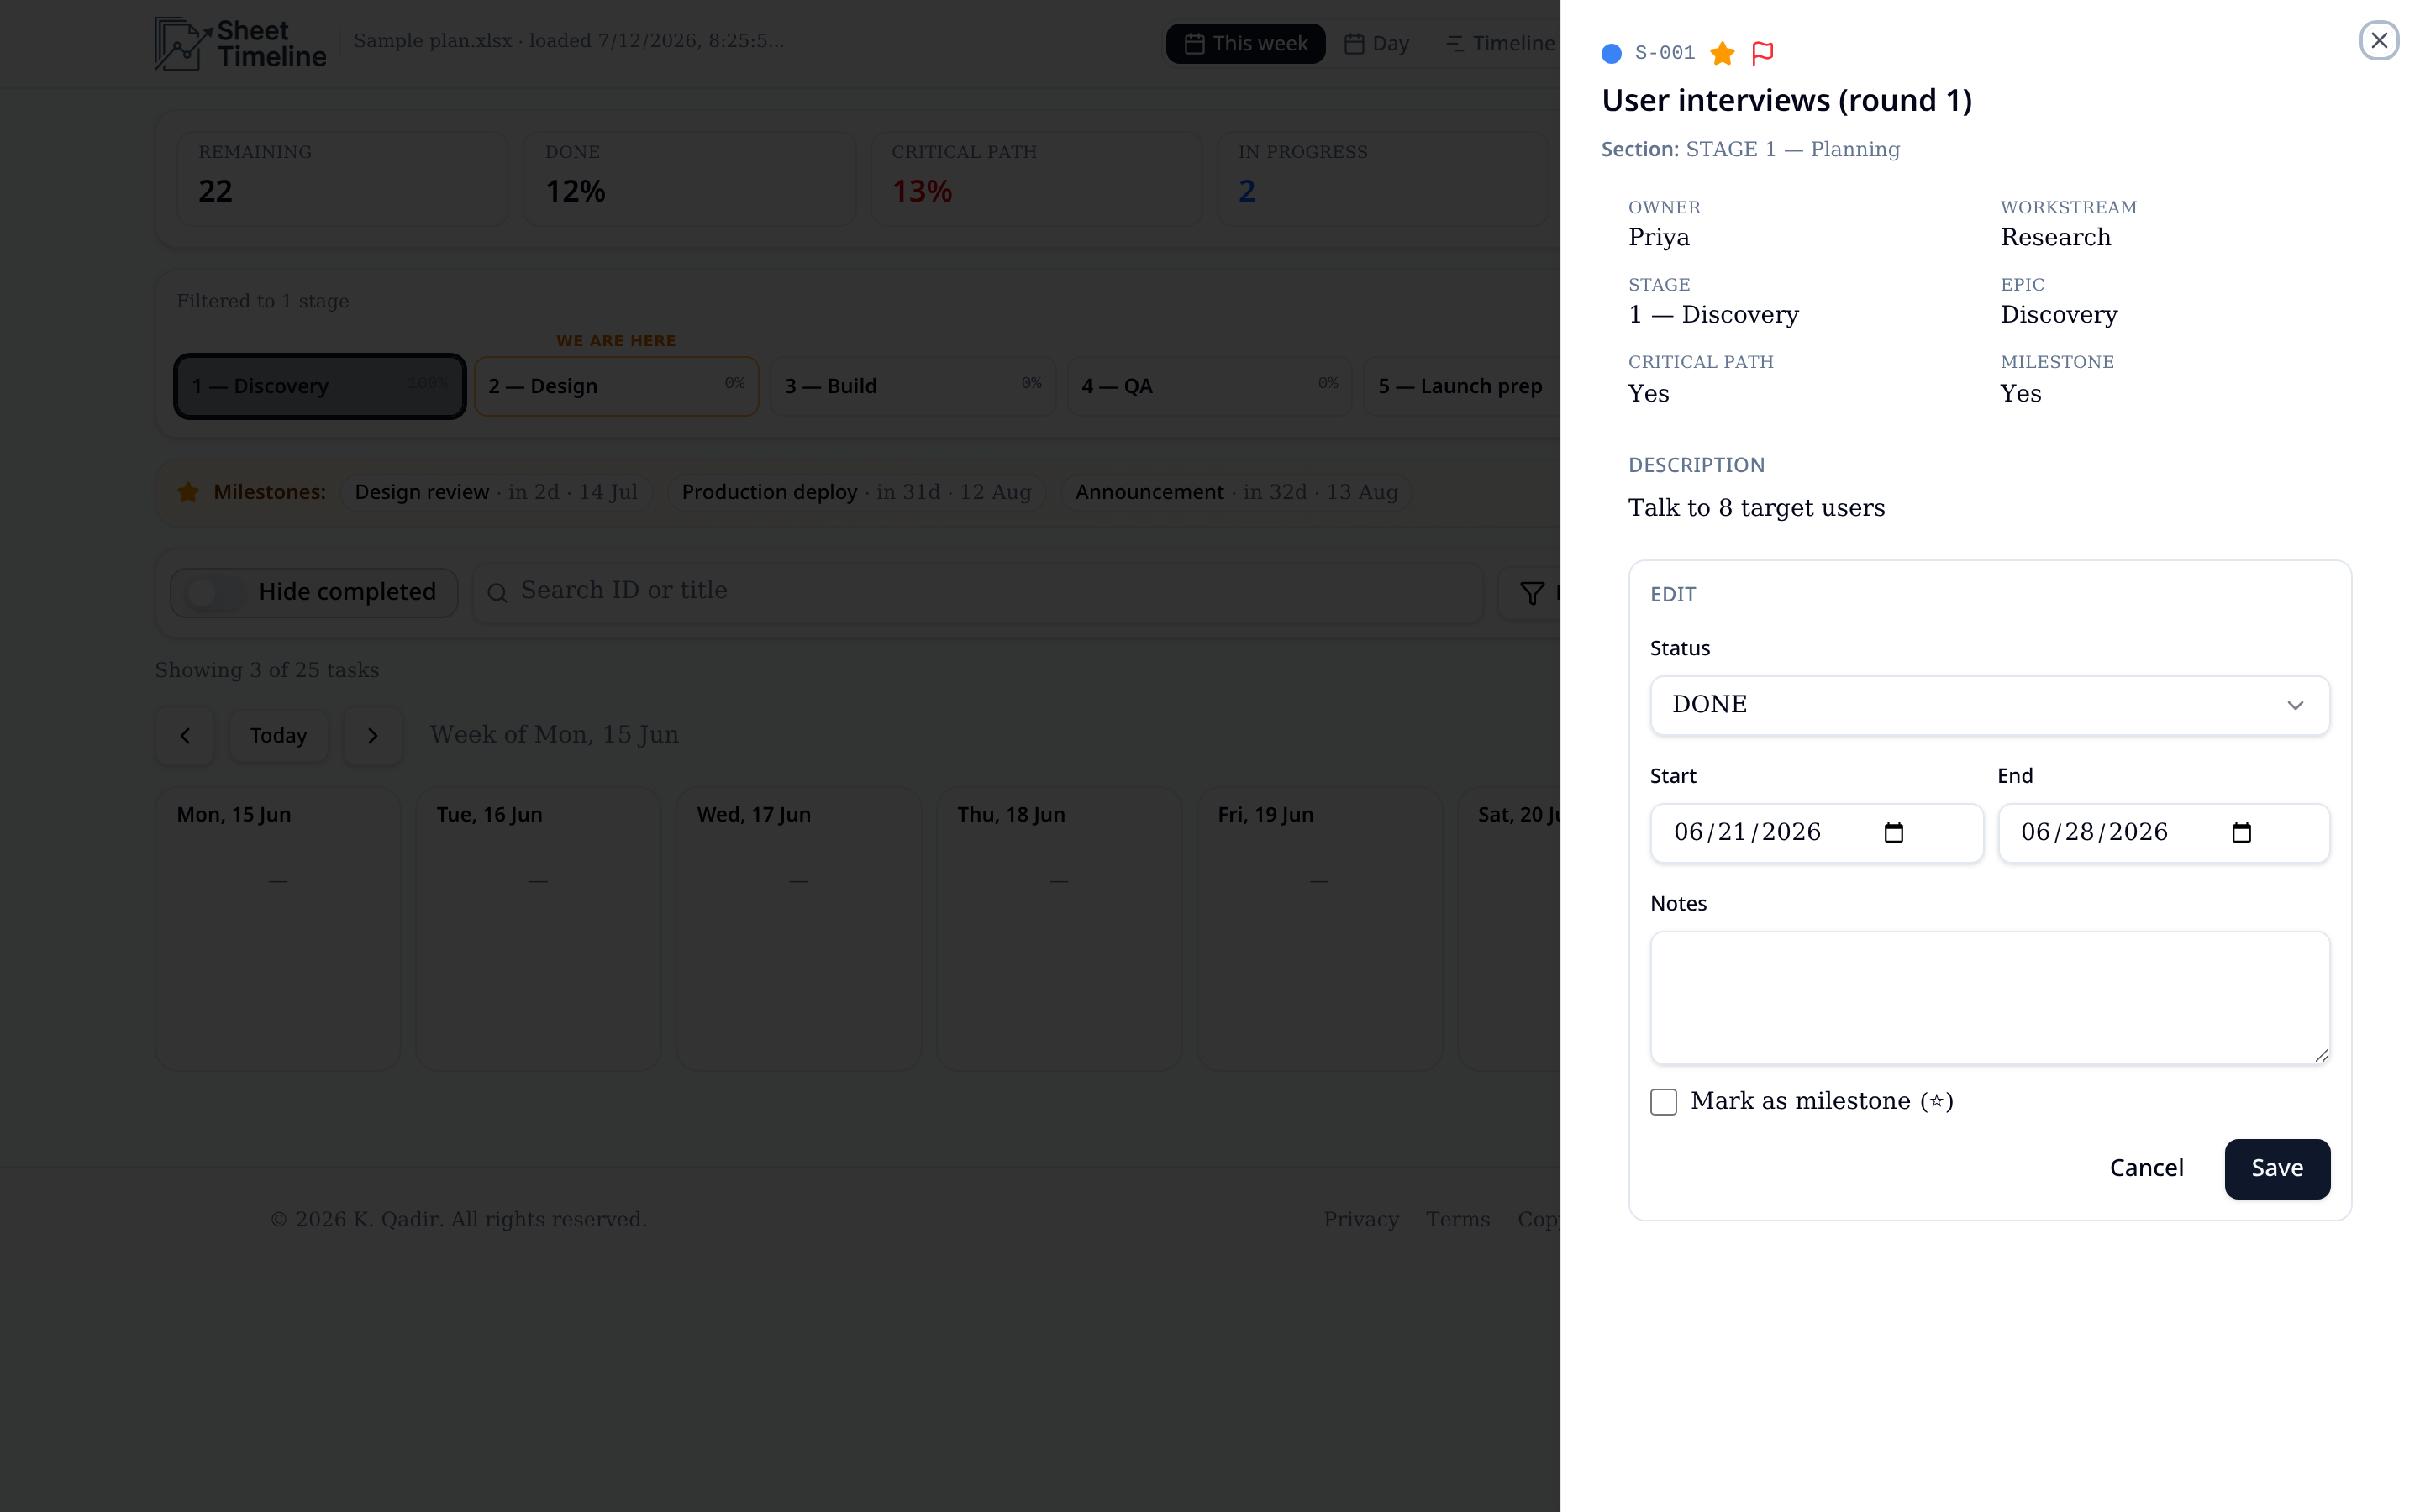
Click any task card, milestone pill, or timeline bar to open the task panel on the right.
6.1 Reading a task
The panel shows every field the plan has for the task: ID, Title, Description, Stage, Workstream, Owner, Depends_on, Critical_Path flag, Start, End, Notes, and status. Two badges may appear at the top of the panel:
- overdue — the task's End date has passed and it isn't
DONE. - late start — today is past the task's Start date but the task is still
NOT_STARTED.
6.2 Editing a task
You can edit a small, well-defined set of fields directly in the panel:
- Status — the dropdown at the top. Changing it re-colours the task everywhere.
- Start and End — pick new dates. The task moves on the week/day/timeline immediately.
- Notes — free text. On export, your note is appended to whatever was already there — the original note is never overwritten.
- ⭐ Milestone toggle — mark or unmark the task as a milestone. Milestones show up in the Milestones strip.
Everything else (title, description, stage, workstream, owner, dependencies, critical-path flag) is read-only on purpose. If you need to change those, do it in Excel and re-load the plan.
6.3 Jumping to dependencies
If the task depends on other tasks, each dependency ID appears as a small clickable chip. Click a chip to open that task instead — a fast way to walk a chain of blockers.
6.4 The quick-complete ✓ and Undo
Every card has a small ✓ you can click without opening the task, to mark it DONE in one step.
A toast pops up at the bottom of the screen with an Undo button — click Undo within a few
seconds to revert the status back to what it was.
6.5 Adding a new task
Sometimes a task comes up that isn't in the spreadsheet yet. Instead of leaving the app and opening Excel, click the + New task button in the header. A small dialog opens where you can fill in:
- ID (pre-filled with a suggestion like
NEW-001; edit if you have your own convention), - Title (required),
- Status, Owner, Workstream, Stage, Epic, Depends on,
- Start and End dates,
- Description and Notes,
- Milestone and Critical path flags.
Only the fields your plan actually uses are shown — if your file has no Owner column, the Owner field is hidden, and so on. Click Add task and it appears immediately in the week, day, timeline, and stage views like any other task. Dated tasks show up in the calendar exactly the same way; undated tasks appear in the Unscheduled panel below the weekly board.
New tasks are tracked separately from edits to existing tasks. The Changes tray shows how many
you've added, and when you End session they are appended as fresh rows to the exported
.xlsx — the original rows are untouched, and any columns your plan uses (including columns not
shown in the dialog) are simply left blank on the new rows.
If you added a task by mistake, open its panel and use the small Remove button to drop it before exporting.
6.6 Baseline variance
If you want to track how much the schedule has slipped since a certain point, use the Capture baseline button in Settings. This stores a snapshot of every task's current Start, End, and Status without changing the plan itself.
Later, when you open any task that existed at the time of the snapshot, the task panel shows a Baseline variance section:
- Red "+N days slip" means the current date is later than the baseline.
- Green "-N days gained" means the current date is earlier than the baseline.
- On baseline means nothing changed for that task.
Use Clear baseline in Settings to remove the snapshot. A new upload automatically clears the baseline, because it is specific to the plan you froze.
6.7 Bulk edit (many tasks at once)
Click Bulk edit in the header to change a group of tasks in one pass. Search by ID, title, or owner, tick the tasks you want (or use Select all), then choose what to apply:
- Set status — one status for every selected task.
- Shift dates — move Start and End together by a number of days (use a negative number to pull the dates earlier). Tasks without dates stay blank.
- Set start / Set end — write the same date to every selected task.
- Milestone flag — mark or unmark all of them as milestones.
- Append note — adds the same line to each task's Notes on export.
Bulk edits behave exactly like individual edits: they land in the Changes tray, they stay local until you export, and you can review them before writing back to Excel.
7. Saving your work
Your edits are remembered automatically in your browser as you make them, even across reloads. When you're ready to write them back into Excel, use the two controls in the header:
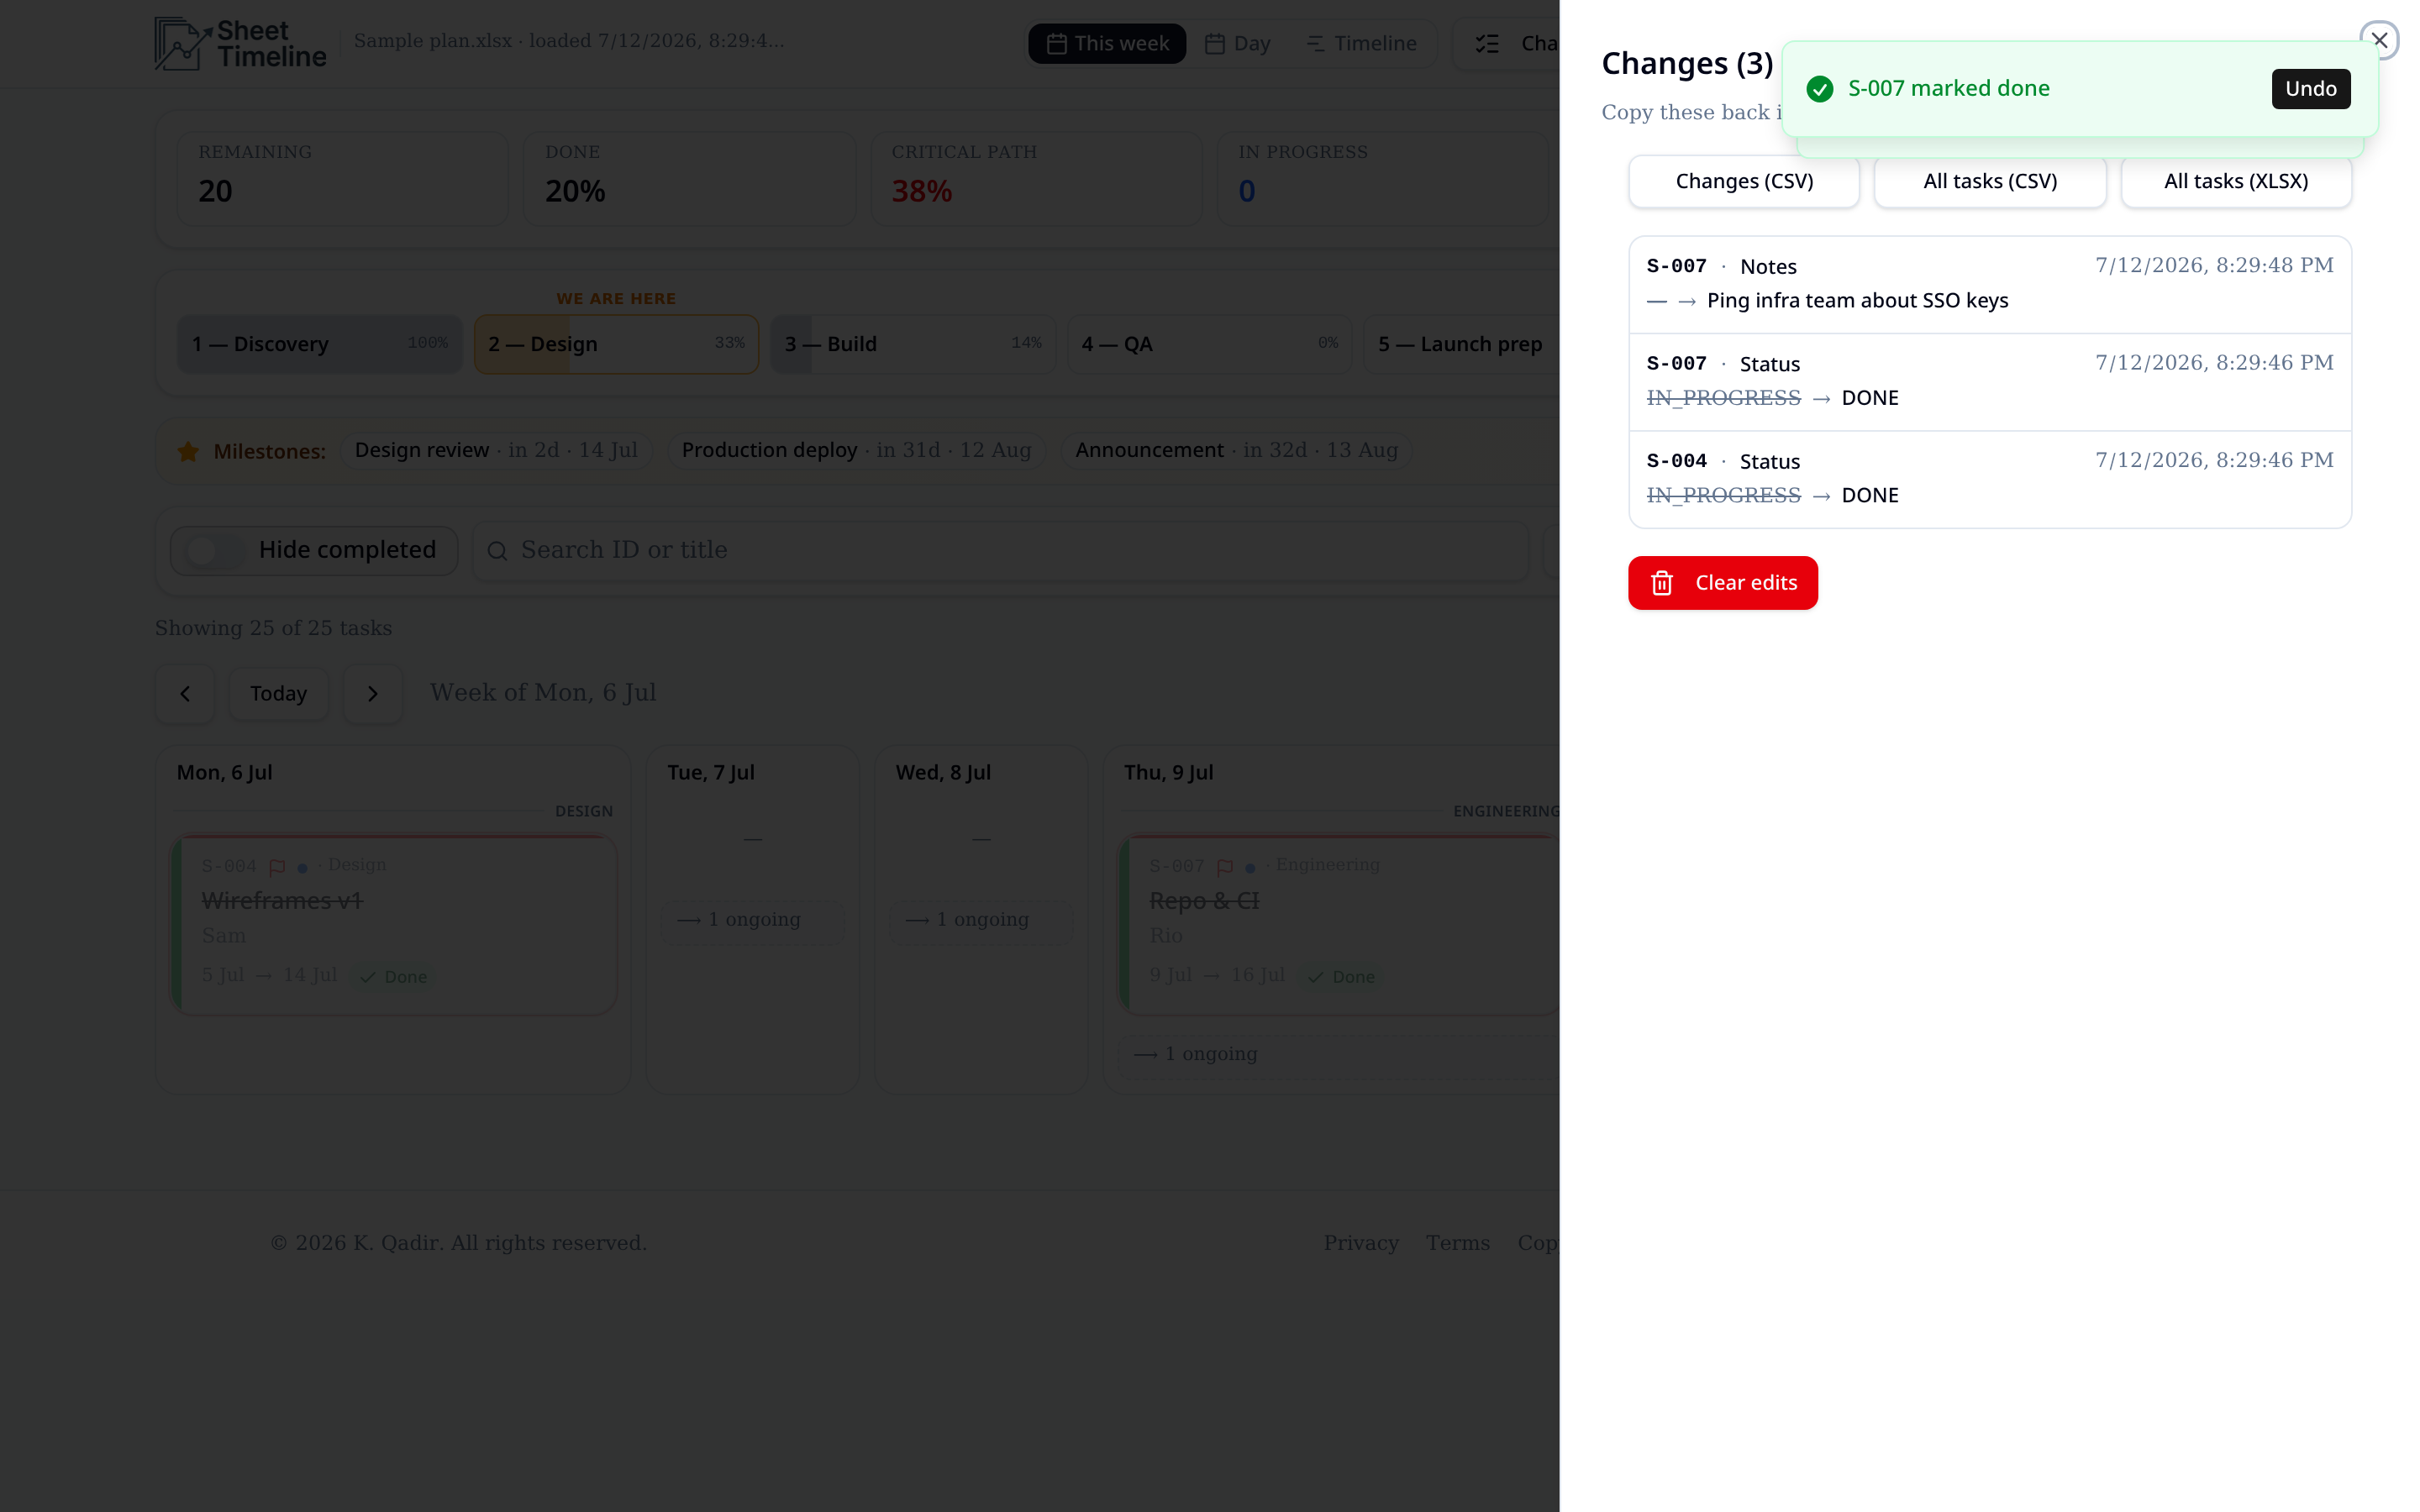
7.1 The Changes tray
Click Changes (the icon shows a small number badge with your edit count). A tray slides in from the side listing every change you've made: which task, which field, from what to what. Handy for a last sanity check before you export.
7.2 End session
Click End session (or End session & export if you have edits or new tasks) in the header. You'll get one of three outcomes, depending on the state:
- No edits or new tasks — a confirmation dialog explains nothing will be written. Confirm to return to the home screen.
- Edits and/or new tasks, and this plan was loaded normally — a confirmation dialog says how
many rows will be updated and how many will be added. Confirm to download a new copy of your
original
.xlsxwith only your edited cells changed and any new tasks appended as fresh rows at the bottom of the Tasks sheet. Formulas, formatting, other sheets, and any columns you didn't touch are left alone. Notes are appended, never overwritten. - Changes made, but this plan was loaded before write-back existed — you'll see an amber banner at the top asking you to re-load the file once. Until you do, End session will offer a changes .csv download instead: a small spreadsheet listing every edit and every new task, ready to apply by hand in Excel.
After a successful export the session ends and you're returned to the home screen. Your edits and your new tasks are now in the file you just downloaded — the app's local memory is cleared for the next plan.
7.3 Share: status reports, calendar, and task lists
Click Share in the header for read-only outputs built from the tasks currently visible (your filters and search apply):
- Status report (.html) — a clean, printable weekly report: headline numbers, what completed recently, what's in progress, what's blocked or overdue, what's coming up next, and upcoming milestones. Great for pasting into a steering deck or printing to PDF.
- Status report (.md) — the same report in Markdown, for wikis and tickets.
- Copy report for email — puts the report text on your clipboard so you can paste it straight into an email or chat.
- Calendar (.ics) — subscribe-free calendar file you can import into Outlook, Google Calendar, or Apple Calendar. Choose Open dated tasks, All dated tasks, or Milestones only. Tasks become all-day events with owner, status, stage, and dependencies in the description.
- Task list (.csv / .xlsx) — a flat export of the visible tasks for further analysis.
None of these change your plan; they're outputs only. Use End session when you want your edits written back into Excel.
8. Using your own plan format (advanced)
If your Excel plan doesn't match the template's column names, sheet name, or status labels, the Mapping wizard opens on first load so you can teach SheetTimeline how to read your file. You can reopen it any time from Settings → Re-map columns & statuses.
The wizard has three steps:
8.1 Choose the sheet and header row
Pick which sheet in your workbook holds the tasks (e.g. Sheet1, Backlog, Plan_v3), and which
row in that sheet is the column headers (row 1 by default). SheetTimeline shows a small preview so
you can confirm you picked the right row.
8.2 Match your columns
For each of SheetTimeline's canonical fields (ID, Title, Status, Stage, Workstream, Owner, Start, End, and so on), pick which column in your file it maps to. Only ID, Title, and Status are required — you can leave the others as "— none —" and the app will hide the matching parts of the screen.
If your plan has no ID column, tick Use row numbers as IDs and SheetTimeline will use the row number in your sheet as each task's ID.
8.3 Match your status names
If your plan uses status labels like In Review, To Do, or On Hold, map each one to one of
SheetTimeline's five categories: NOT_STARTED, IN_PROGRESS, BLOCKED, DONE, DEFERRED.
8.4 Save as a profile
At the end of the wizard you can save the mapping as a profile with a name (e.g.
Acme Roadmap). Next time anyone on your team loads a file with the same shape, they can pick the
profile from Settings and skip the wizard entirely.
Profiles can also be exported as .json files from Settings and imported on another
computer — so the team maps the format once, then shares the profile around.
9. Settings
Click the ⚙ Settings icon in the header to open the settings popover.
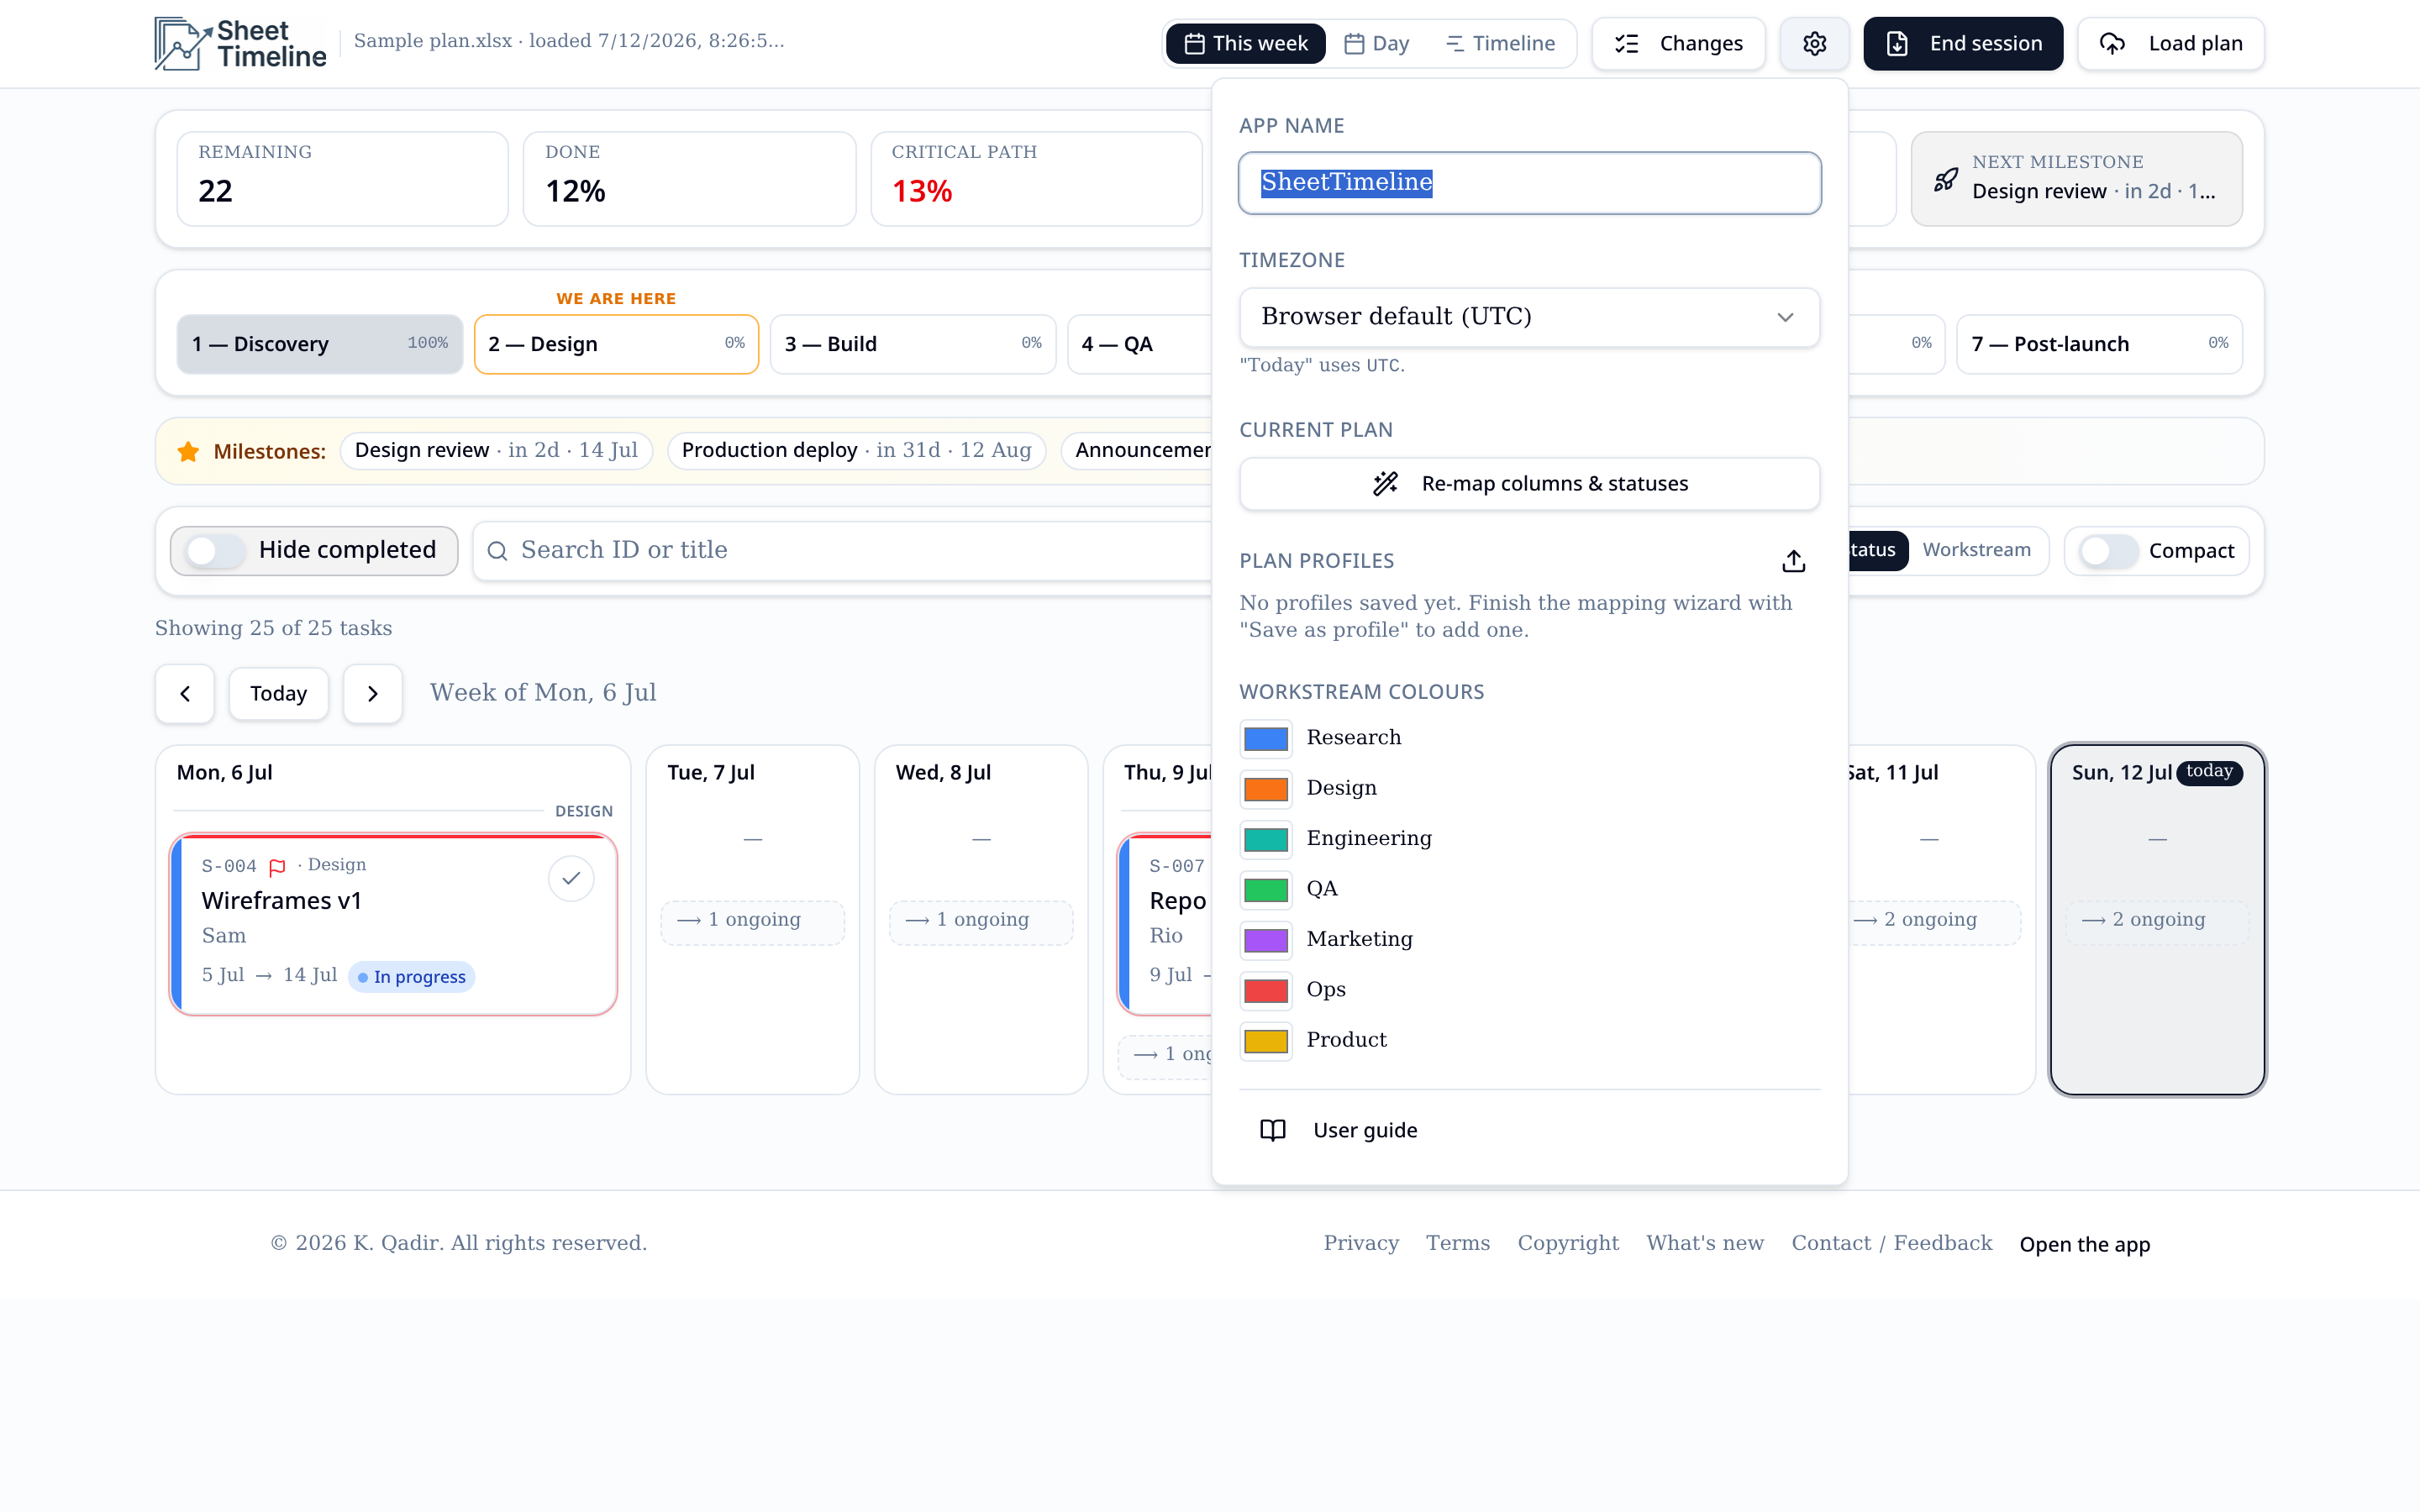
- App name — the label shown in the header. Defaults to
SheetTimeline; change it to anything you like (e.g.Acme Roadmap) — the browser tab and monogram follow. - Timezone — SheetTimeline uses this to decide what "today" means, which day a task shows up on, and whether a task is overdue. Defaults to your browser's timezone. Change it if your team is in a different one than the computer you're on.
- Current plan — a shortcut to Re-map columns & statuses if you want to change how the current file is interpreted.
- Plan profiles — the list of saved mapping profiles for your team. Rename, delete, or export each one; import a profile from a file with the small upload button.
- Workstream colours — one colour swatch per workstream in the current plan. Click a swatch to override the automatic colour; click reset to go back to the default palette colour.
- Capture baseline / Clear baseline — freeze or remove a snapshot of the current schedule so you can see variance in the Task drawer later (see §6.6).
- User guide — downloads this document as a self-contained HTML file.
10. Your data & privacy
Everything you do in SheetTimeline stays on your computer.
- Your Excel file is read in your browser. It is never uploaded to a server.
- Your edits, your mapping profiles, your app-name and colour choices are stored in your browser's local storage on this computer, so they survive a refresh. They are not synced to any cloud.
- If you clear your browser's site data for SheetTimeline (or use a private/incognito window), everything the app remembers is wiped. Export your session first if you want to keep your edits.
- The public SheetTimeline website tracks anonymous visit counts (unique visitors, sessions) so we can show honest usage numbers on the landing page. Nothing derived from your plan or your edits is ever sent.
11. Troubleshooting & FAQ
My file won't import. SheetTimeline needs three columns to work: an ID, a Title, and a Status. Make sure at least those exist on the sheet you're pointing the wizard at, and that the header row you picked is the one with the actual column names — not a title row above it.
My statuses aren't recognised. SheetTimeline has five status buckets: NOT_STARTED,
IN_PROGRESS, BLOCKED, DONE, DEFERRED. If your plan uses different words (like In Review
or On Hold), reopen the wizard from Settings → Re-map columns & statuses and map each of your
labels to one of the five.
Tasks show up on the wrong day, or something looks wrongly overdue. This is almost always a timezone mismatch. Open Settings and set the Timezone to the one your project is planned in. The screen refreshes immediately.
A stage shows — instead of a percentage. That stage has no tasks with dates yet, so there's
nothing to complete a percentage against. Add Start/End dates to at least one task in the stage and
it will populate.
I clicked a stage but the calendar didn't move. That stage has tasks but none of them have dates. The list still filters; the calendar just has nowhere to jump to. A small toast at the bottom of the screen tells you this when it happens.
Where did my edits go after reload? Nowhere — they're saved in your browser. If they've truly disappeared, either your browser's site data was cleared, or you opened SheetTimeline in a different browser or a private window. There's no way to recover them without the exported file.
The exported file looks unchanged. By design: SheetTimeline only overwrites the specific cells you edited. If you scroll to the tasks whose Status/Start/End/Notes/Milestone you actually changed, you'll see the new values there. Everything else — formulas, formatting, other sheets, other columns — is untouched on purpose.
© 2026 K. Qadir. All content, screenshots, and documentation are the property of K. Qadir and may not be copied, redistributed, or reused without written permission.
Changelog
| Version | Date | Notes |
|---|---|---|
| 1.5.0 | 2026-09-10 | Reorganized §3 around the simplified workspace zones and refreshed Figure 3. |
| 1.4.0 | 2026-09-01 | Added §6.7 "Bulk edit" and §7.3 "Share: status reports, calendar, and task lists". |
| 1.3.1 | 2026-08-31 | Updated §2.1 to describe the expanded sample dataset (39 tasks, nine owners) and which features it demonstrates. |
| 1.3.0 | 2026-07-16 | Updated §9 Settings to document the baseline capture/clear controls; other sections refreshed for the five-view feature set. |
| 1.2.0 | 2026-07-15 | Added sections for the Network view, My tasks multi-owner view, Owner workload heatmap, and Baseline variance. |
| 1.1.0 | 2026-07-13 | Added §6.5 "Adding a new task"; updated §7.2 "End session" to cover new-task rows appended on export. |
| 1.0.0 | 2026-07-12 | Initial guide covering SheetTimeline as of spec 2.4.0 (feature set unchanged). |